Bitcoin Price Key Highlights
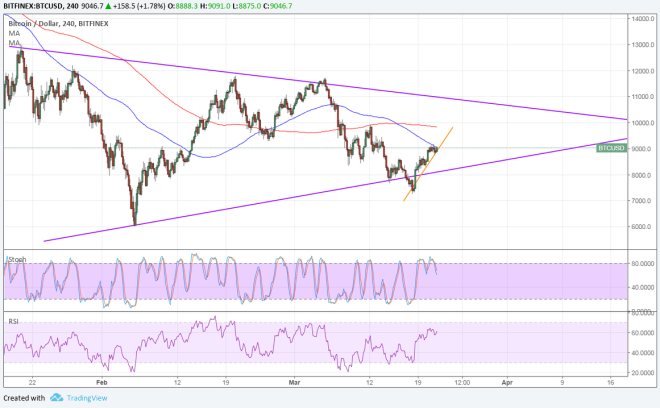
- Bitcoin price has formed lower highs and higher lows to create a symmetrical triangle on the 4-hour chart.
- Price is bouncing off the support and might be due for a move back to resistance around $10,000-11,000.
- A small rising trend line can be drawn to connect the latest lows, but technical indicators are giving bearish hints.
Bitcoin price is bouncing off its symmetrical triangle support and might be eyeing the resistance from here.
Technical Indicators Signals
The 100 SMA is below the longer-term 200 SMA to indicate that the path of least resistance is to the downside. This means that the selloff is likely to resume than to reverse. Also, the 100 SMA is holding as dynamic resistance at the moment and could push bitcoin price back to the bottom of the triangle or lower.
A break below support could take bitcoin price down by the same height of the triangle, which spans $6,000 to nearly $13,000. Stochastic is indicating overbought conditions and appears to be starting its move south, so bitcoin price might follow suit.
RSI has some room to climb, so bitcoin bulls could stay in the game for a bit longer. However, this oscillator is also nearing overbought levels so the nearby areas of interest could hold as resistance, including the 200 SMA dynamic inflection point.

Market Factors
The dollar weakened on the FOMC statement even after the US central bank hiked rates. It turns out traders were disappointed over the lack of hawkish hints, particularly when it came to the dot plot of rate hike forecasts.
Fortunately, bitcoin price was able to take advantage of this, along with the pickup in risk appetite. So far, there are still no negative updates coming from the G20 Summit, putting investors at ease.
Remarks from Twitter CEO citing that bitcoin would be the world’s single currency also lifted bitcoin price. In an interview with The Times, Dorsey said:
“The world ultimately will have a single currency, the internet will have a single currency. I personally believe that it will be bitcoin.”