
Bitcoin Price Key Highlights
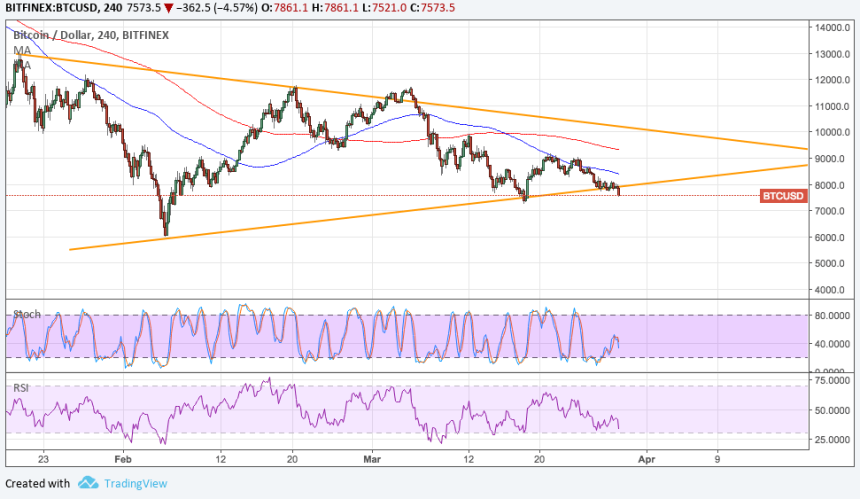
- Bitcoin price is starting to breach support of its symmetrical triangle to signal that a downtrend is underway.
- Zooming out to longer-term charts reveals that this triangle could be a bearish flag formation, which typically signals continuation.
- Technical indicators are showing that bearish momentum could stay in play for a bit longer.
Bitcoin price is breaking below its symmetrical triangle support to signal that a downtrend is about to happen.
Technical Indicators Signals
The 100 SMA is below the longer-term 200 SMA to indicate that the path of least resistance is to the downside. In other words, the selloff is more likely to continue than to reverse. The 100 SMA also recently held as dynamic resistance.
Stochastic has climbed out of the oversold region but appears to be changing its mind before gaining any upside traction. This suggests that bears are still trying to put up a stronger fight. RSI has some more room to fall before hitting oversold conditions or showing that sellers are tired.

Market Factors
Liquidity is expected to thin out in the next few days as most traders are out enjoying the Holy Week holidays. This could also mean potentially more volatile moves as price could be more sensitive to headlines and smaller positions.
Risk aversion seems to be leaving a mark in the markets as traders continue to fear geopolitical risks stemming from trade negotiations and Trump’s meeting with North Korea’s leader. A return in risk-taking, however, could prove bearish for the dollar and positive for bitcoin price.
Twitter has moved to ban ICO ads on its platform, leading to speculations of lower investor interest and activity. Reddit has also disabled bitcoin payments.
On the longer-term charts, traders are also anxious about the forming death cross, which is a crossover of the 50 SMA on the 200 SMA, which typically ushers in more selling momentum.