Bitcoin Price Key Highlights
- Bitcoin price is sustaining its short-term rally since breaking past a descending trend line.
- However, this could merely be part of a bearish correction to the Fib levels on the 4-hour chart.
- Note that bitcoin price is still trading inside a descending cannel and is just approaching the correction area.
Bitcoin price was able to sustain its climb but is approaching a correction zone visible on longer-term charts.
Technical Indicators Signals
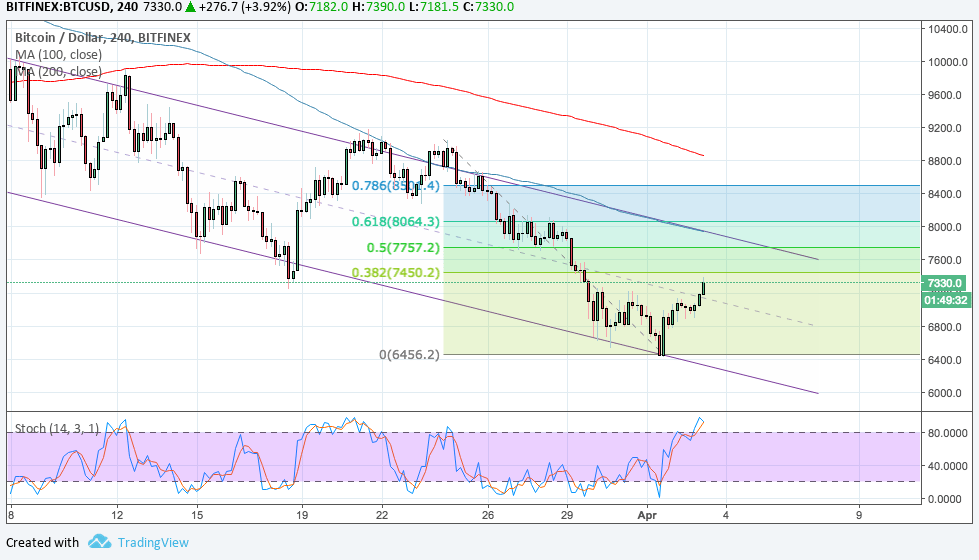
The 100 SMA is still below the longer-term 200 SMA to confirm that the path of least resistance is to the downside. In other words, the downtrend is still likely to resume, possibly when bitcoin price tests the Fibonacci retracement levels.
The 38.2% Fib level is at $7450.2 just past the mid-channel area of interest. The 50% Fib is at $7750, which lines up with a former support turned resistance. The 61.8% level is close to the top of the channel at the $8064.3 level and the 100 SMA dynamic inflection point, which coincides with the channel resistance to add to its strength as a ceiling.
If any of these resistance levels hold, bitcoin price could resume the drop to the swing low at $6450 or create new ones closer to the channel bottom at $6000. Stochastic is already dipping into oversold territory to signal that selling pressure is about to return now that buyers are feeling exhausted.

Market Factors
Analysts are pointing to the pickup in the overall cryptocurrency market as one of the factors that propped bitcoin price higher, even though the gains were mostly in other altcoins. Over the past 12 hours, volumes have ticked higher in exchanges like Bitfinex and Binance.
If bitcoin price is able to hold its ground above the $7000 level, analysts predict that it could soon make another test of $8000 and perhaps even break higher if activity stays supported. Note, however, that the US has its NFP report due later in the week and this could strongly impact overall sentiment in the financial markets, including cryptocurrencies.