

Bitcoin Price Key Highlights
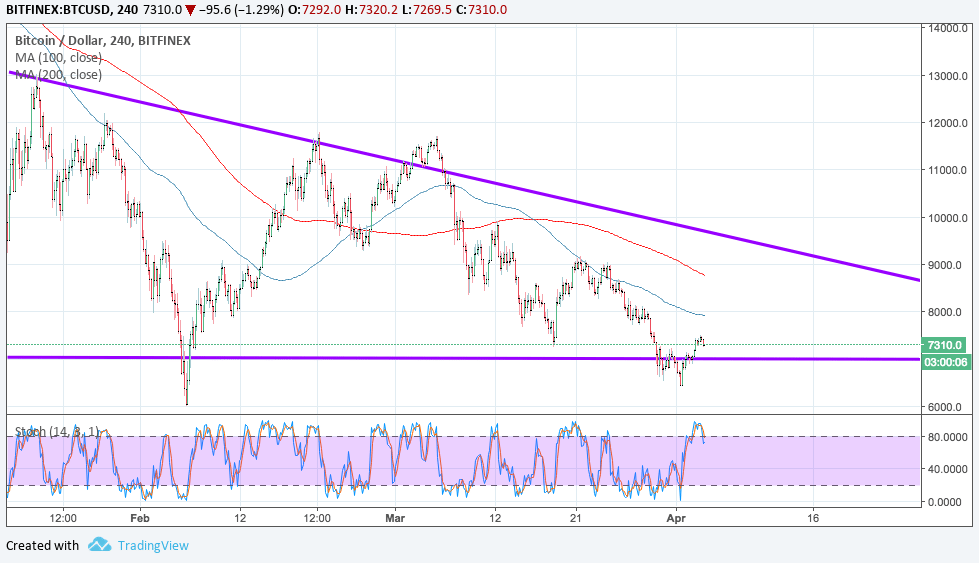
- Bitcoin price has formed lower highs and found support around $6500 to $7000 to create a descending triangle pattern.
- Price is bouncing off support and might be due for a move back up to the resistance around $9000.
- Technical indicators, however, are signaling that a breakdown might be due.
Bitcoin price is trading inside a descending triangle and testing support, still deciding whether to go for a bounce or a break.
Technical Indicators Signals
The 100 SMA is below the longer-term 200 SMA to signal that the path of least resistance is to the downside. This suggests that the selloff is more likely to resume than to reverse. Also, the moving averages could hold as near-term resistance levels in the event of a pullback.
Stochastic is already indicating overbought conditions and could be due to move back down. This would reflect an increase in selling pressure and possibly send bitcoin price below the triangle support. In that case, price could fall by roughly the same height as the chart formation.

Market Factors
Bitcoin price was off to a decent start for the month and quarter but it seems that bulls are having trouble holding on to the gains. Risk appetite was present in recent trading sessions but dollar strength is also in play as geopolitical risks eased on cooling U.S.-China trade tensions.
By the looks of it, investors are taking the recent bounce as an opportunity to liquidate their holdings at a better price while analysts predict that bitcoin price could take more hits in the months ahead. Then again, seasonal data suggests that bitcoin price tends to recover during the second quarter of the year so there could be some upside from here.
Meanwhile, US NFP data due later in the week could also set the tone for dollar action and risk sentiment in the financial markets, which also typically affects bitcoin direction.