

Bitcoin Price Key Highlights
- Bitcoin price gained further traction on its bounce off the bottom of its descending triangle.
- This also represents a bullish breakout from the symmetrical triangle formation on its short-term charts.
- This could lead to a move all the way up to the resistance and area of interest.
Bitcoin price has its sights set on the next potential resistance near the $10,000 mark as bulls are back in action.
Technical Indicators Signals
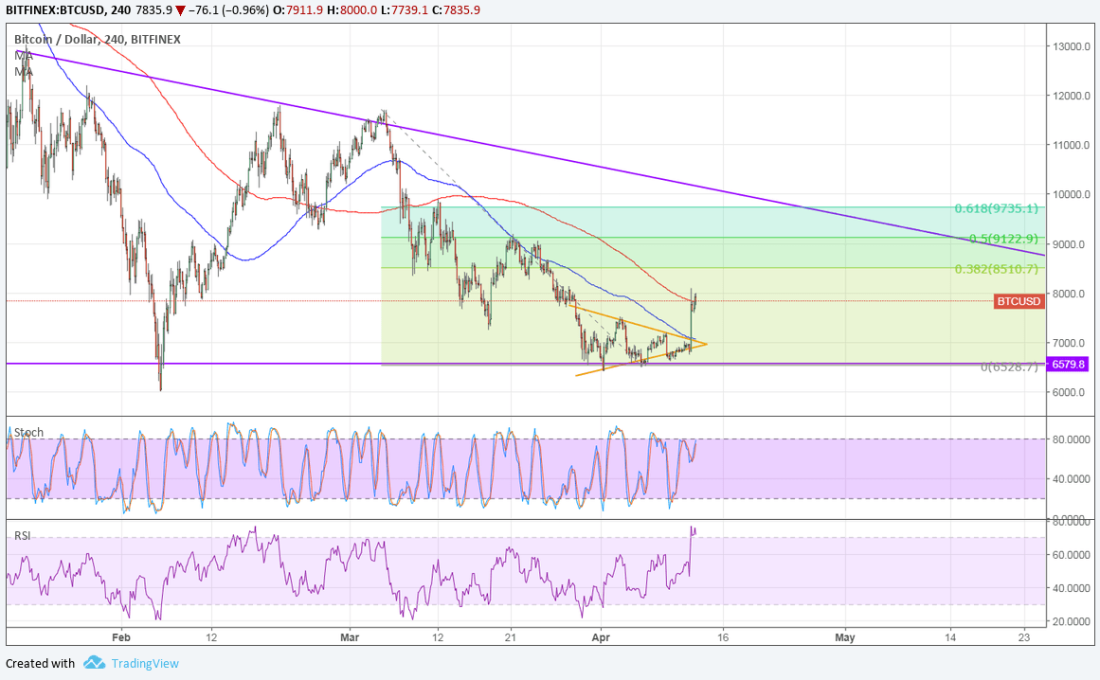
The 100 SMA is below the longer-term 200 SMA on the 4-hour time frame to signal that the path of least resistance is to the downside. In other words, the selloff could still resume from here, unless bitcoin price is able to complete a strong upside break from the 200 SMA dynamic inflection point.
Once that happens, bitcoin price could test the nearby inflection point at the 38.2% Fib around $8500 or the 50% Fib at $9122. The 61.8% Fib lines up with the triangle resistance near $10,000, which is also a key area of interest.
Stochastic is pointing up to show that buyers still have enough energy to push for more gains, but RSI is already indicating overbought conditions to show that sellers could take over. In that case, another test of the triangle support could occur or perhaps a break lower. Note that the chart pattern spans $6,500 to $13,000 so the resulting breakout could be of the same size.

Market Factors
The approaching tax filing deadline was seen as one of the main factors causing bitcoin price to start the week on a downbeat note and now that profit-taking is almost over, bitcoin could resume trading on fundamentals. Apart from that, investors seem to have renewed their appetite for risk lately.
News that big investor families like that of George Soros are getting a stake of the cryptocurrency market has been bullish for bitcoin and its peers. This could mean an influx of funds, compensating for the expected dip in activity stemming from the recent bans on ICO advertising and cryptocurrency activity in India and Pakistan.