

Bitcoin Price Key Highlights
- Bitcoin price bounced off the bottom of its rising channel and looks ready for a move back to the top.
- The Fibonacci extension tool shows the next upside targets from here.
- However, technical indicators are suggesting that the selloff could still resume.
Bitcoin price found support at $9,000 once more and could set its sights higher, but technicals still reflect bearish pressure.
Technical Indicators Signals
The 100 SMA is crossing below the longer-term 200 SMA to signal that the path of least resistance is to the downside. In other words, the selloff is still likely to resume. In addition, the 100 SMA appears to be holding as dynamic resistance for the time being.
RSI is on the move up but seems ready to turn lower to indicate a return in selling momentum. Stochastic is heading south from the overbought zone, so bitcoin price might follow suit. A break below the $9,000 level could be enough to sustain a reversal from here.

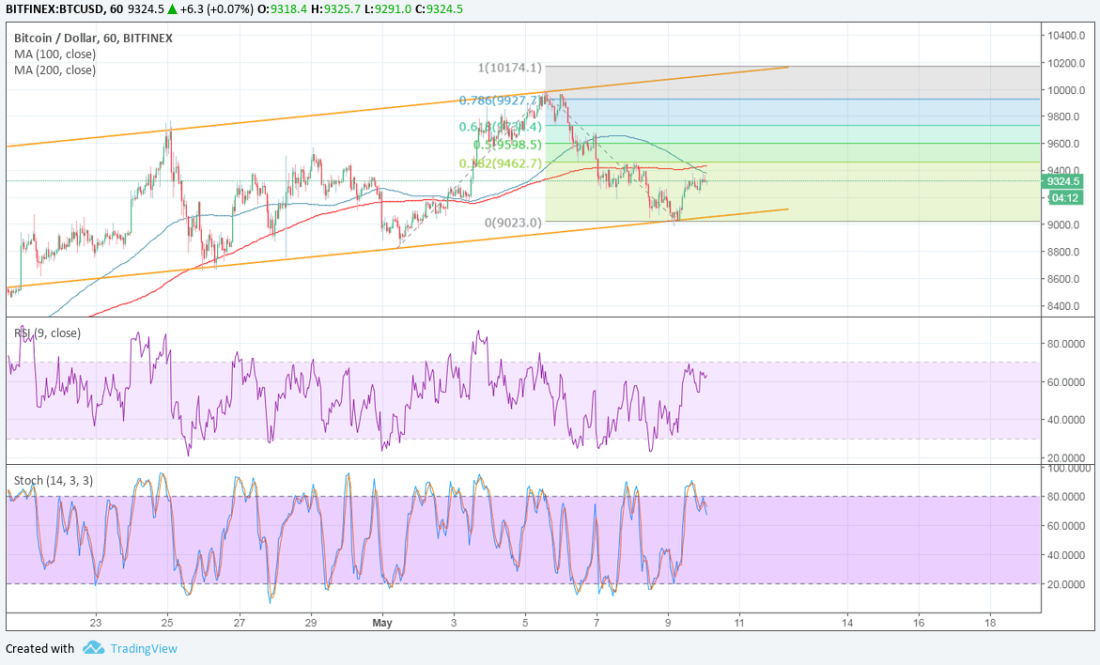
But if bulls stay in control, bitcoin price could pull up to the next resistance at the 38.2% extension or the 50% level at the mid-channel area of interest at $9600. The 61.8% extension is located near $9700 then the 76.4% extension lines up with the swing high. The full extension is at $10,174 just past the channel top.
Market Factors
Bitcoin price seems to be resilient against the factors weighing on it these days, as investors are likely putting more focus on the earlier positive developments. It has been reported that ICE will be launching a bitcoin exchange, which could draw more liquidity and activity even for other altcoins.
For now, though riskier assets like bitcoin are being weighed down by risk aversion stemming from geopolitical risk. Recall that Trump announced that the US would pull out of the Iran deal, which could keep geopolitical tensions heightened for the time being. This scenario is usually more bullish for the dollar and other safe-haven assets.