The market pulled the price of bitcoin downwards after rising to over $310 2 days ago which means that a high percentage of traders are taking profit by closing their long positions. The take-profit theme of yesterday’s market halted the bullish wave which started a few days ago.
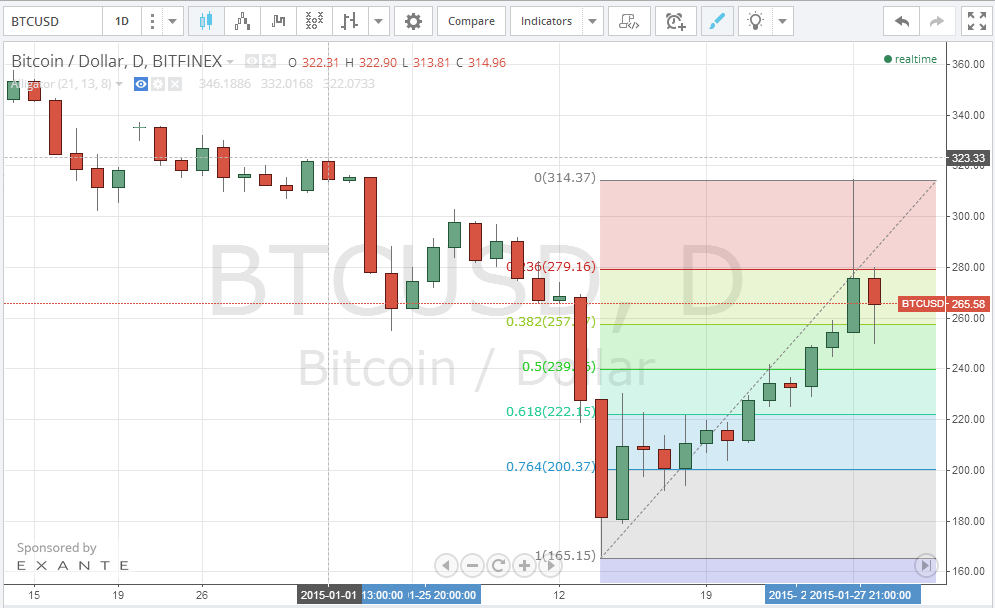
By drawing a trend line that extends from the low reached on the 14th of January ($165) and the high reached on the 26th of January ($314) and plotting the Fibonacci retracement on the 1 day Bitfinex (BTC/USD) charts from tradingview.com (look at the below chart), we can see that the price has dropped to $263 which touches the 38% Fibonacci retracement line today as the market attempted to correct the price. The market may continue trying to correct the price by pulling it further down to the 50% retracement line, or it would more likely rise to test the $300 resistance.
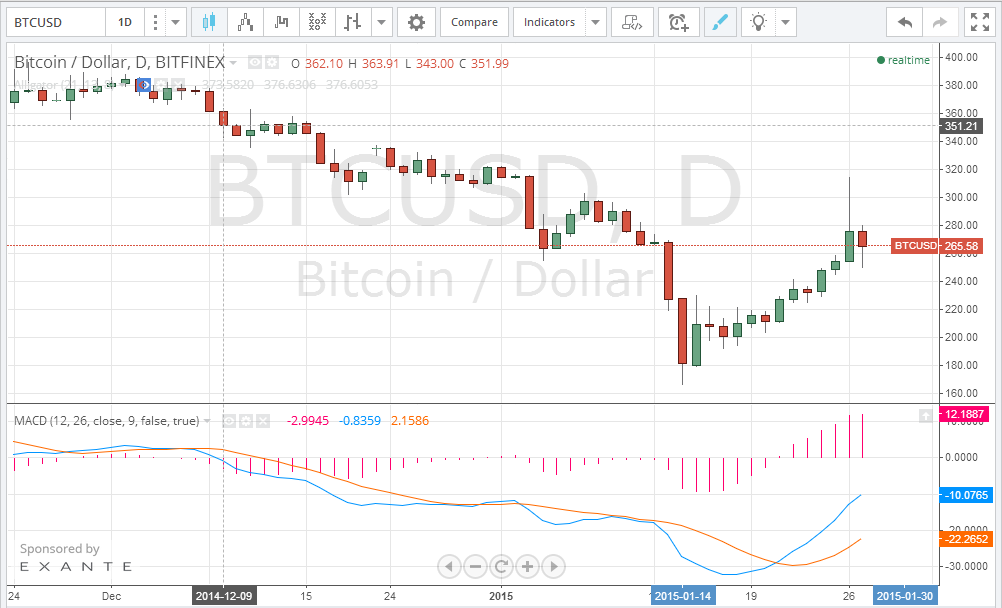
By plotting the MACD indicator on the 1 day Bitfinex (BTC/USD) charts from tradingview.com (look at the below chart), we can see that the blue MACD line is still above the red signal line which means that the price correction is likely to end soon and we can see the price going higher soon.
If yesterday’s decline in bitcoin price continues, we can see the price falling below the $256 resistance line, before rising up again to test the $300 resistance.
Charts from Bitfinex