In this morning’s analysis, we discussed the reversal of the overarching bullish momentum we had seen in the bitcoin price overnight, and suggested that it might just be corrective and – in turn – we could see a return to the upside throughout the Friday European session. While the bitcoin price remains within the range we defined earlier, action this afternoon has brought us to trade just shy of resistance, and it looks like we may get some further upside as we head into the Friday evening session and beyond, into the weekend.
The Sunday session (as the markets open in Asia) have become notorious for generating large moves on the intraday charts in the bitcoin price over the last few months, and we expect similar this weekend. Ahead of this move, however, what do we expect will play out in the markets? Further, where are we looking to get in and out of the markets on any volatility? Take a quick look at the chart to get an idea of what’s on.
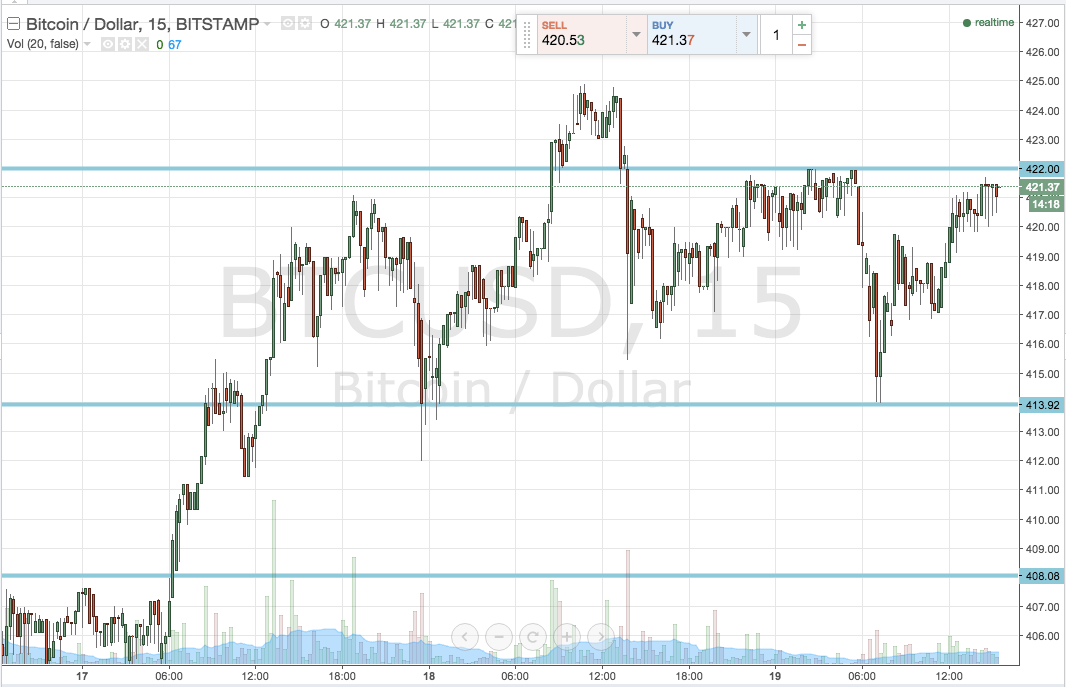

As the chart shows, since we haven’t broken this morning’s predefined range to either the upside or the downside, we are simply going to maintain its position going forward. As such, in term support holds firm at 413.92, while resistance comes in unchanged at 422 flat.
Looking at our breakout strategy, and again simply to reiterate the entries we noted this morning, if action closes above resistance we’ll enter long in expectation of a return to the overarching bullish trend that has brought us to trade in the 400s this week. We’ll target 428 and limit our downside with a stop around 419.
On the short side of things, we will enter to the downside on a correction from current levels, with a downside target of in term support. Further, on a break of support, we’ll enter a second short position towards 400 flat. Stops just the other side of both entries define our risk.
Charts courtesy of Trading View