It’s Thursday morning, and time to take the first of our twice tdaily looks at the bitcoin price. Action overnight has been relatively flat, but this doesn’t mean that we don’t have anything to go at this morning. Generally, sideways action will serve up some pretty solid outside parameters, and we can incorporate these parameters into our strategy pretty effectively. So, with that said, and as we head into fresh session this morning, let’s take a look at what we’re focusing on from a range and target perspective, as well as having a look at the levels at which we will attempt to get out of the markets if price turns against us.
As ever, take a quick look at the chart below to get an idea of what we’re focusing on. It is a 15 minute candlestick chart showing the last 24 hours with action, and it has our primary range overlaid in blue.
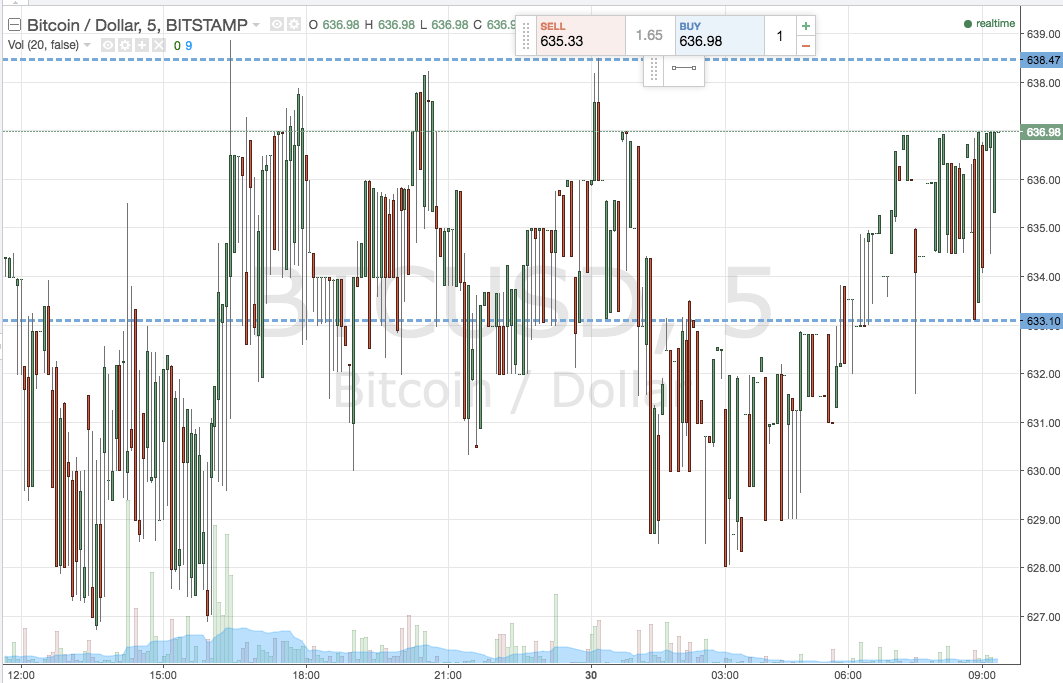

As the chart shows, the range in focus for today is defined by 633 flat to the downside, which gives us a nice solid support level and one that we have used succesfully in the past, and 638 will offer up resistance to the upside. It is quite a tight range, so we will be looking at trading breakout only rather than break out and intrarange. Why? Because our intrarange strategy likely won’t offer us enough room to effectively manage our risk. Specifically, if price closes above resistance, we will look to enter a long position towards an initial upside target of 648. A stop loss on this position somewhere around 636 keeps risk tight. Looking the other way, if price breaks below support, we will enter short trade towards 625. A Stop loss at 636 once again ensures we are taken out of the trade in the event of a piobiass reversal.
Charts courtesy of Trading View