So that’s it, another week out of the way. As we noted in this morning’s bitcoin price analysis, things have been pretty wild this week. Price gave us plenty to go at with our intraday scalp strategy (and in turn, plenty to discuss as part of our intraday analyses) and we have managed to close out the week net up on the markets, despite the odd stop loss hit here and there. We’ve got a weekend’s worth of action ahead of us, however, and as those who are regular readers will be all too aware, price can often be extremely volatile over the weekend, despite the dip in volume. Sunday has historically been a big day for peaks and troughs, and we will be watching price closely for any indication that we might see such action heading into the weekend’s close.
So, with this in mind, and ahead of the closing bell out of the US this evening, let’s take a look at the bitcoin price and see if we can’t outline some key levels, and form an actionable strategy going forward.
Take a look at the chart below to get an idea of our primary focus levels – it’s a five-minute candlestick chart and our range in focus is – as ever – overlaid in green.
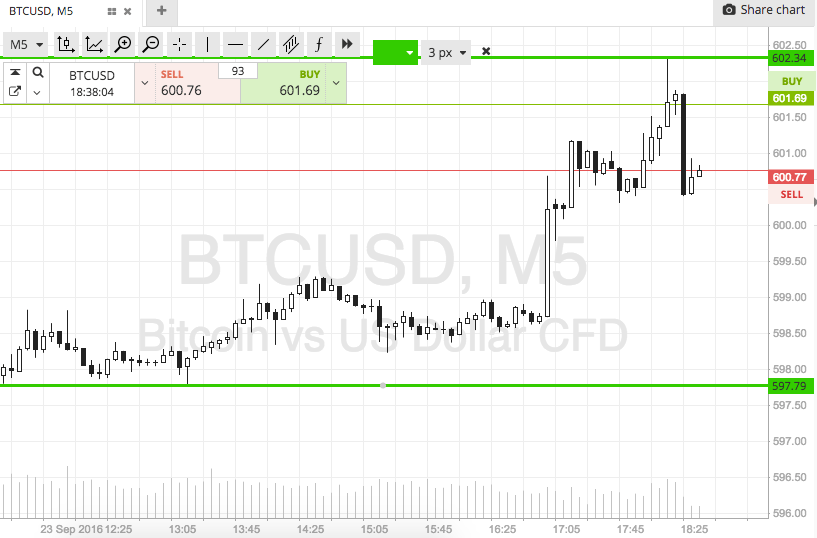

So, as the chart shows, we are looking at support to the downside at 597 and resistance to the upside at 602. These levels are a little too close together for an intrarange approach, so let’s look at a breakout scalp strategy only right now.
If price manages to break through resistance to the upside, we will look to get in long towards an immediate upside target of 608. A stop on the position at 600 defines risk nicely.
Conversely, if price breaks through support, we will enter short towards 590 to the downside. Again we need a stop, and again somewhere in the region of 600 looks good.
Charts courtesy of SimpleFX