There are a couple of things I’m not a fan of, and both of them are change. When I sat down at my desk this morning, however, I noticed three things. One, that my cookies had mysteriously evaporated from my Chrome browser, and that everything looked and felt slightly alien as a result. Two, that one of these alien experiences was the color of my bitcoin price trading platform. Three, that I kind of like the change, and I think I’m going to give it a shot at becoming my new normal.
Probably not the sort of thing our intraday scalping visitors really care about reading, but I knew my cookies had disappeared (albeit not why) and I felt our regular readers deserved some kind of explanation as to the color theme switch as well. Who knows.
Anyway. Let’s get to the bitcoin price.
Things have been great for the last week or so. Price has been up and down nicely, and we’ve managed to get in and out of the markets according to the rules of our strategy for a profit on a number of occasions.
There’s been some rough times, but overall we are on top.
With that in mind, let’s look at today. Take a look at our lovely new black and green chart below to get an idea of our key levels.
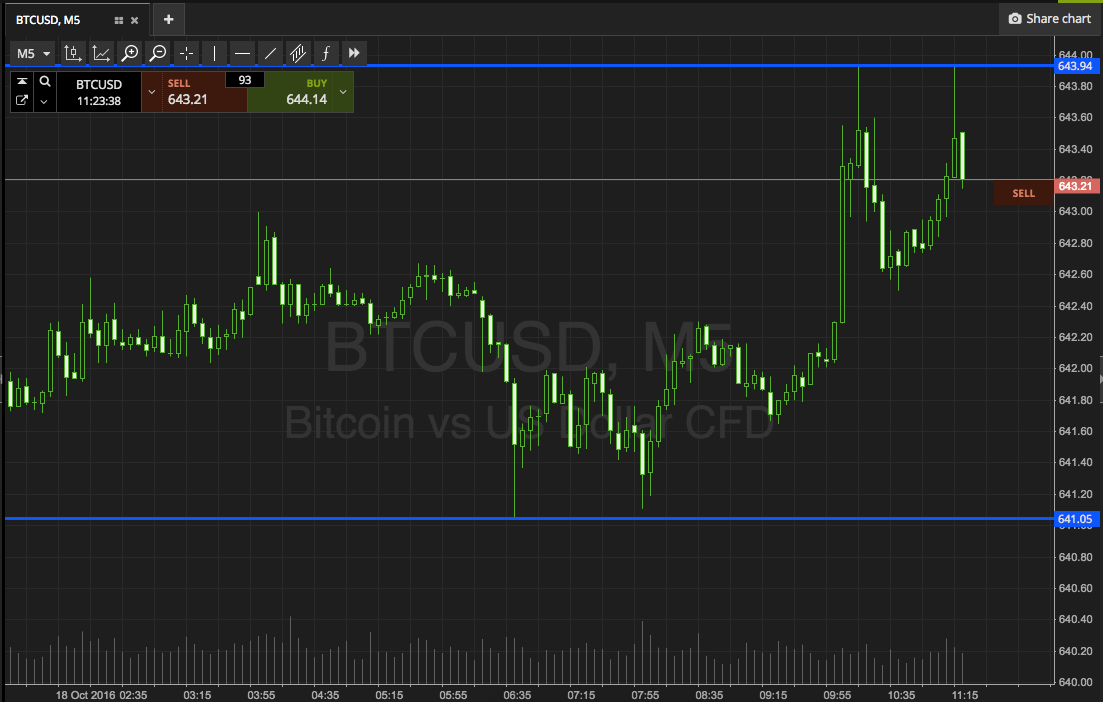

As the chart shows, the levels we are focusing on are in term support to the downside at 641 flat, and in term resistance to the upside at 644. These are now becoming pretty standard levels, but we will almost definitely see a break soon.
When we do, if it’s a close above resistance, we are going to get in long towards an immediate upside target of 650 flat.
Conversely, if price closes below support, we are going to get in short towards 635. A stop on both positions just the other side of our entry works to define risk nicely.
Happy trading!
Charts courtesy of SimpleFX.