Before the weekend kicked off, we highlighted the potential for the breaking of the 700 level to the upside in the bitcoin price as being likely if action continued to move in the way it had done so throughout the week last week. Well, as it turns out, we did see a breaking of this level, and price has managed to remain about 700 – something that, given the break, was not looking particularly likely. This makes things interesting for the week ahead. We have seen a major level broken, and hold, and this suggests that – medium term at least – we are going to see some level of support around 700 (hinting at more upside).
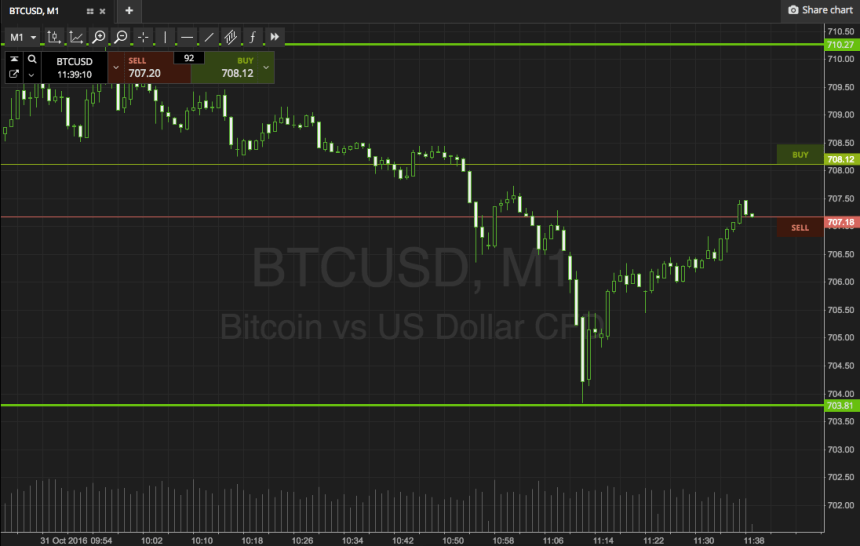
So, with this said, and as we head into a fresh week of trading, here is a look at what we are focusing on in the bitcoin price this morning, and where we are going to look to get in and out of the markets according to our intraday strategy. As ever, take a look at the chart below to get an idea of what’s on.
As the chart shows, our target range for this morning is defined by support to the downside of 703 and resistance to the upside at 710. There is just about enough room to go at price from an intrarange perspective, so long at support and short at resistance, with a target of the opposing level. On both positions a stop loss just the other side of the entry level (say, $2 either way, will ensure we are taken out of the trade in the event of a bias reversal. Looking at our breakout strategy, if we see price break above resistance, we will get in long toward 750. Conversely, a close below support will signal short towards 700 flat, with a very tight stop loss necessary around 704.
Happy trading!
Charts courtesy of SimpleFX
