Action in the bitcoin price today has been relatively lackluster, once again. We managed to get in a little earlier on a breakout scalp trade, but apart from that, things have been pretty flat. We’re heading into this evening’s session with some degree of optimism, however, based on an expectation of a volume boost come the late US session.
So, as ever, let’s close out the European session with a look at what went on today, and where we are looking to get in and out of the markets on any volatility as things play out this evening.
As ever, take a look at the chart below to get an idea of the levels in focus. It’s a five minute candlestick chart showing the last twelve hours’ worth of action in the bitcoin price, and it’s got our key levels highlighted in green.
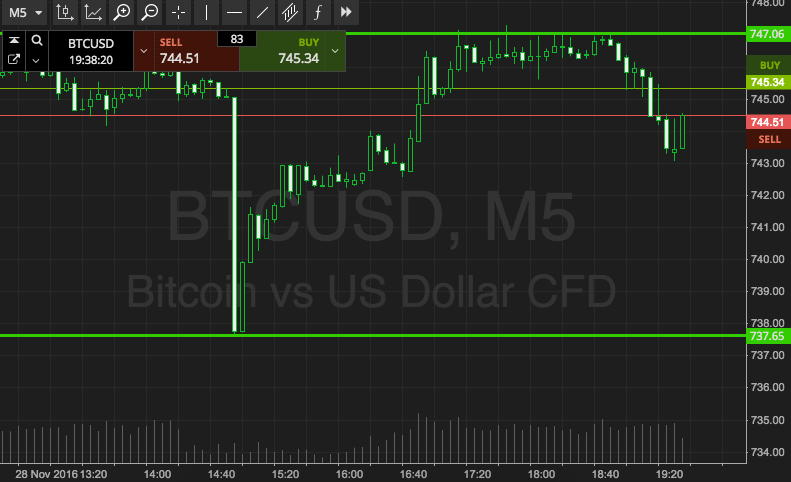

As the chart shows, then, we are looking at a range defined by in term support to the downside at 737 and in term resistance to the upside at 747. With about $10 dollars’ worth of range available, we’ve got enough room to go at price with an intrarange approach, so we’ll be looking to get in long towards resistance as an upside target if price bounces from support, and we’ll get in short on a correction from resistance towards a target of support. As usual, stops just the other side of entry define risk.
For our breakout entries, we will look for a close above resistance to give us an excuse to get in long, and we’ll go after an upside target of 755. A stop on this one at 745 kills off risk on the trade.
Conversely, a close below support will signal short towards 730, and we’ll use a stop loss around 740 to ensure we are taken out of the trade in the event of a bias reversal.
Charts courtesy of SimpleFX