So we’re off to a fresh day of trading in the bitcoin price, and with any luck, we’ll get some volatility this morning. Volume picked up yesterday evening, and the frequency of breakout entry opportunities increased, but price has remained relatively flat for the early morning session out of Asia. Those who tagged along last week will know we have had some difficulty with our take profits over the last week or so. Not difficulty in the sense that we haven’t been able to get in and out profitably, but that because of the lack of volume (and the resulting lack of any real follow through on breakouts) we’ve had to use really narrow targets. With the volume spike last night, and a couple of good entries earlier in the week, this now seems to be resolved, so… Onwards!
Let’s get to the important stuff.
As ever, take a quick look at the chart below before we get started to see the levels in focus, and also what happened over night in the bitcoin price.
The chart is a five-minute candlestick chart and it’s got our range overlaid in green.
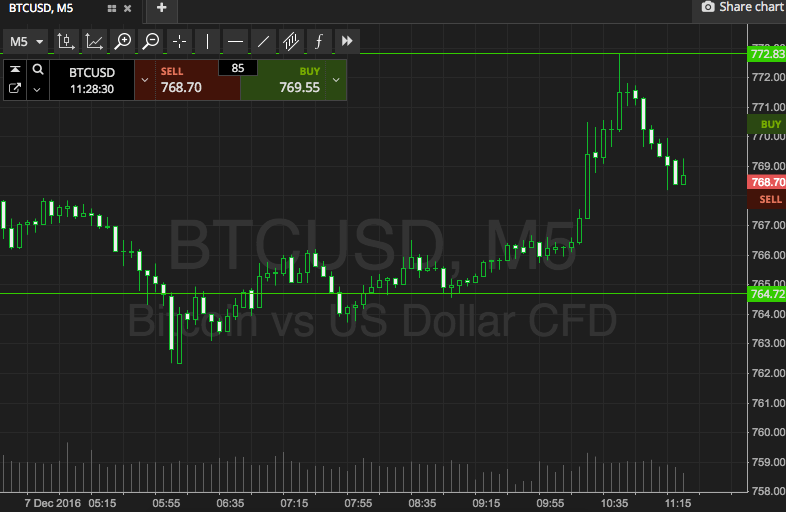

So, as the chart shows, we are looking at support to the downside at 764 flat, and resistance to the upside at 772. We’ve mentioned it’s a tight range, and this means we won’t be going after price intrarange; instead we’ll be focusing on breakout near term. Another note – the range is very similar to the one we used last night, just with a slightly widened out resistance level to the upside.
Anyway, if price closes above resistance, we will look to get in long towards an immediate upside target of 780 flat. A stop on the trade at 769 looks good.
Looking south, if price closes below support, we will get in short towards 757 flat. A stop on this one at 767 works well.
Let’s see how things play out…
Charts courtesy of SimpleFX