Well, things are getting interesting now. We’ve been watching closely for a break of the 800 flat level in the bitcoin price for what seems like forever, and based on last week’s action, it looked like we might have to wait a little bit longer. Sometimes, however, a session can make all the difference, and that’s what we’ve seen during daytime Europe on Monday. Aside from the potential 800 target, we’ve also managed to get in long on a break of this morning’s predefined resistance, which subsequently ran straight up and through our profit target. A nice scalp profit was followed by a bit of sideways action (likely price just consolidating as the short-termers pulled profits off the table and participants realigned their bias) and we’re heading into this evening with what will hopefully turn out to be a volume driven bit of sustained momentum.
So, with this in mind, let’s get to the nitty gritty. The chart below is a five-minute candlestick chart showing the action as we’ve just described it, and it’s got a rejigged range overlaid highlighting the focus levels for this evening’s session. Take a look at that before we get started.
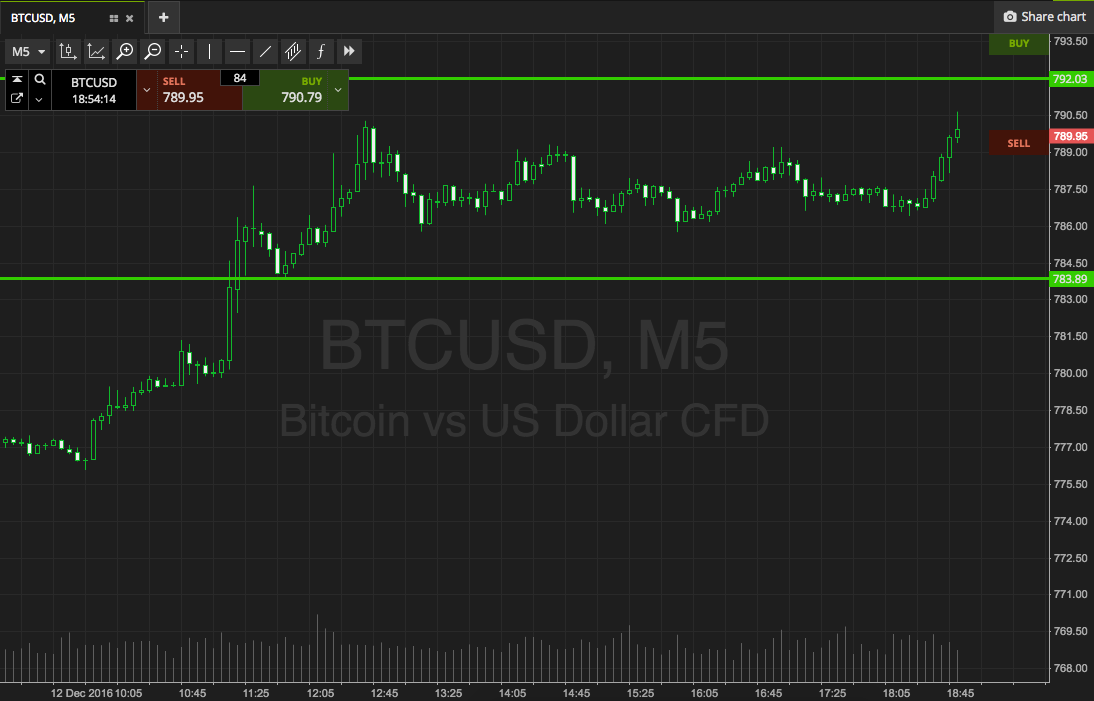

Here’s the exciting bit – an upside break.
If we see price break through in term resistance at 792, we’re going to be entering long with an immediate upside target of the big 800 flat. A stop on the entry somewhere around 788 kills off our downside risk.
If price dips (and we’re hoping it doesn’t) we’ll begrudgingly get in short towards 775.
Let’s see how things play out…
Charts courtesy of SimpleFX