So Friday has now drawn to a close, and with it the week, and it is time to take the final look at the bitcoin price of the week. In this morning’s analysis, we noted that price has been relatively flat all week, ranging between a pretty solid and well defined range of around the 600 mark, give or take five dollars either side. This has meant that we haven’t had too much of an opportunity to get in and out of the bitcoin price markets as we might have liked, and when we did get in, we were forced out relatively quickly based on our risk management parameters. With any luck, this weekend, we will see an uptick in volume, and get a little bit more action and sustained momentum moving forward. Whatever happens, we are going to ensure that we are ready to take advantage of the action in question. So, with the scene set, let’s take a look at the levels in focus. Before we get started, take a look at the chart below. It is a 15 minute candlestick chart, and it shows the last 12 hours or so worth of action. It also has our range overlaid in green.
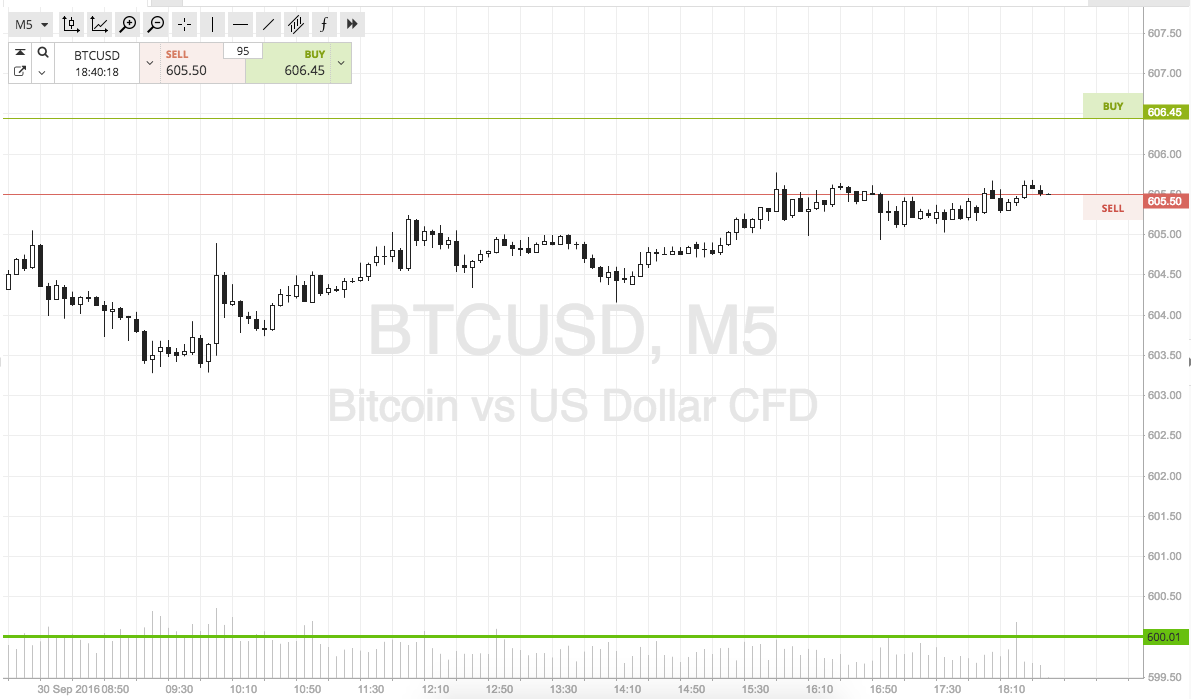

As the chart shows, the levels we are focusing on are support to the downside at 600 and resistance to the upside at 610. As has been the case for the majority of the week, we will be sticking with our breakout strategy, and not going for any intrarange trades this evening.
Specifically, we will watch for a close above resistance to validate an immediate upside entry towards 615. a stop loss on this position somewhere in the region of 608 looks good. If price break below support, we will enter a short position towards 595. A stop on this one at 602 works nicely.
Charts courtesy of SimpleFX