
Reason to trust
How Our News is Made
Strict editorial policy that focuses on accuracy, relevance, and impartiality
Ad discliamer
Morbi pretium leo et nisl aliquam mollis. Quisque arcu lorem, ultricies quis pellentesque nec, ullamcorper eu odio.
Bitcoin is attempting to start a fresh increase above $9,000 against the US Dollar. BTC price could either rally above $9,000 or start another decline towards $8,400.
- Bitcoin is facing a major resistance near the $9,000 and $9,020 levels.
- The price is trading above the 100 hourly simple moving average, but struggling to gain momentum.
- There is a crucial bearish trend line forming with resistance near $8,945 on the hourly chart of the BTC/USD pair (data feed from Kraken).
- The pair could either start a strong rally above $9,000 or it might dive back to $8,400.
Bitcoin is Approaching Next Key Break
Yesterday, bitcoin failed to stay above the $9,000 level and resumed its decline against the US Dollar. BTC price traded below the $8,800 support and revisited the $8,580 support area, where the bulls took a strong stand.
A new weekly low is formed near $8,533 and the price recently started a fresh increase. There was a break above the $8,800 resistance level and the 100 hourly simple moving average.
Bitcoin price climbed above the 50% Fib retracement level of the downward move from the $9,209 high to $8,533 low. However, the price is facing a strong resistance near the $8,950 and $9,000 levels.
There is also a crucial bearish trend line forming with resistance near $8,945 on the hourly chart of the BTC/USD pair. The pair seems to be struggling to clear the 61.8% Fib retracement level of the downward move from the $9,209 high to $8,533 low.
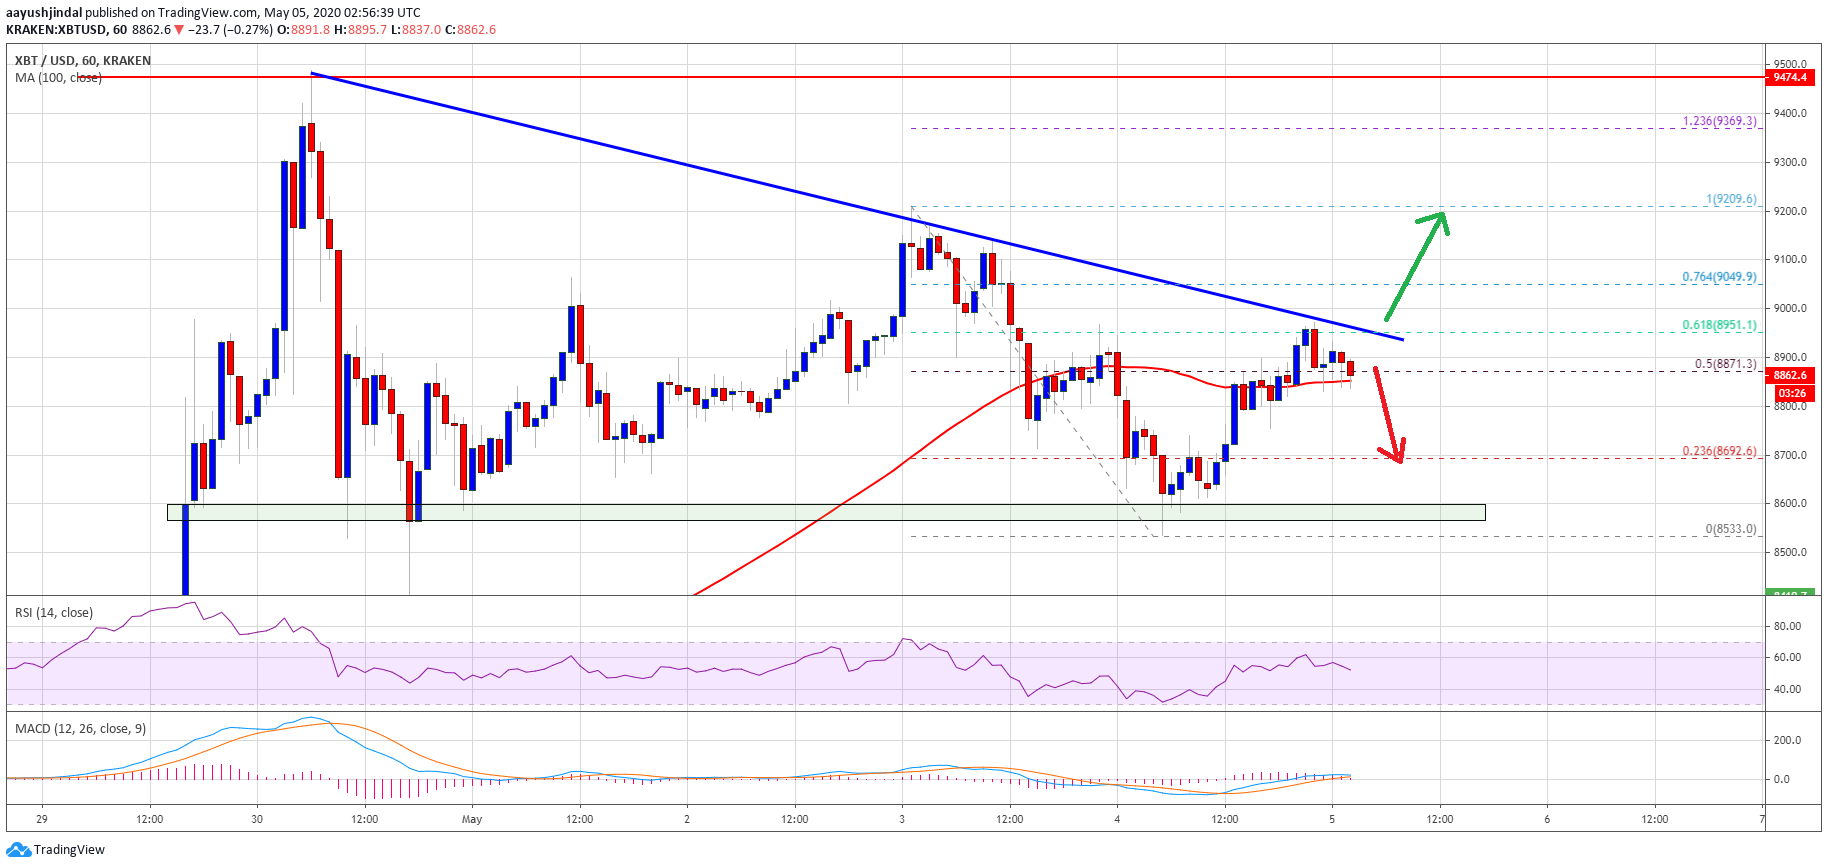
The main resistance is near the $9,000 region. Therefore, BTC must break the trend line, $8,950, and the $9,000 barrier to start a strong rally in the coming sessions. The next key resistance is near the $9,200 level, followed by the $9,500 weekly resistance.
Downside Spike?
If bitcoin price fails to continue above the trend line resistance and $9,000, there are chances of a fresh decline. An initial support is near the $8,800 level and the 100 hourly SMA.
A successful close below the 100 hourly SMA might start a major decline towards the $8,580 and $8,540 support levels. The price could even spike towards the $8,400 support area before starting a fresh upward move.
Technical indicators:
Hourly MACD – The MACD is about to move back into the bearish zone.
Hourly RSI (Relative Strength Index) – The RSI for BTC/USD is currently declining and approaching the 50 level.
Major Support Levels – $8,580 followed by $8,400.
Major Resistance Levels – $8,950, $9,000 and $9,200.