

Key Points
- Bitcoin cash price found support near the $1,460 level and recovered nicely against the US Dollar.
- This week’s major bearish trend line with resistance at $1,580 was broken on the hourly chart of the BCH/USD pair (data feed from Kraken).
- The pair also moved above the $1,600 resistance level, which is a positive sign in the near term.
Bitcoin cash price is back in a positive zone above $1,600 against the US Dollar. BCH/USD must settle above $1,675 and the 100 hourly simple moving average to gain momentum.
Bitcoin Cash Price Support
After further declines, bitcoin cash price was able to find support near the $1,460 level against the US Dollar. The price traded as low as $1,463 and later started an upside move. It traded higher and broke the 23.6% Fib retracement level of the last decline from the $1,702 high to $1,463 low. It opened the doors for more gains and the price traded above a few important hurdles such as $1,550 and $1,600.
More importantly, this week’s major bearish trend line with resistance at $1,580 was broken on the hourly chart of the BCH/USD pair. The pair also moved above the 50% Fib retracement level of the last decline from the $1,702 high to $1,463 low. These all are positive signs since the price is now well above the $1,600 level. At the moment, buyers are struggling to place the price above $1,650 and the 100 hourly simple moving average. Moreover, the $1,675 level is also a crucial resistance.
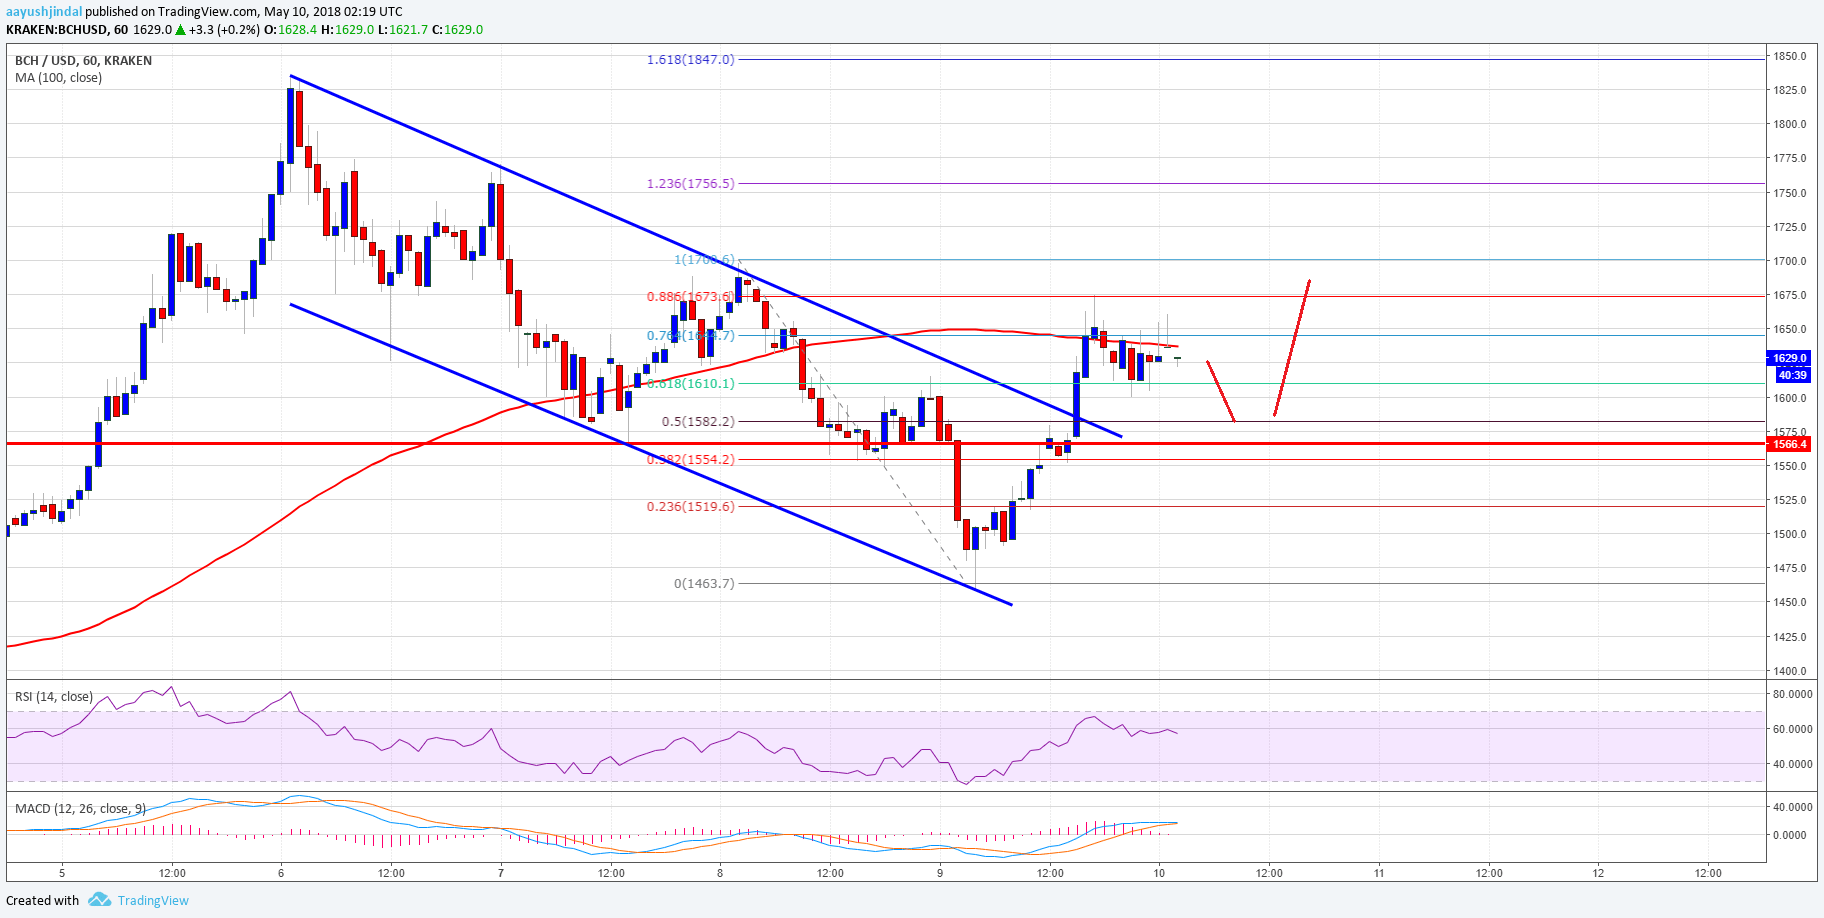

Looking at the chart, it seems like a proper close above the $1,650 and $1,675 resistance levels may push the price further higher. On the downside, the broken resistances at $1,600 and $1,565 may now act as supports.
Looking at the technical indicators:
Hourly MACD – The MACD for BCH/USD is currently flat in the bullish zone.
Hourly RSI (Relative Strength Index) – The RSI for BCH/USD is now well above the 50 level.
Major Support Level – $1,565
Major Resistance Level – $1,675