
Key Points
- Bitcoin cash price rocketed higher and moved to a new all-time high above $3700 against the US Dollar.
- There is a new connecting bullish trend line forming with support at $3000 on the hourly chart of BCH/USD (data feed from Kraken).
- The pair might move down a bit, but it remains supported around the $3000 handle.
Bitcoin cash price surged higher above $3000 and $3500 against the US Dollar. BCH/USD is now super bullish with more gains possibility above $3500.
Bitcoin Cash Price Uptrend
Yesterday, we discussed how bitcoin cash price could continue to move above the $2000 level against the US Dollar. The price started a solid upside move and broke many resistances on the way up such as $2500, $3000 and $3500. A new all-time high was formed at $3747 and at the moment, the price is correcting lower. On the downside, an initial support is around the 23.6% Fib retracement level of the last leg from the $2000 low to $3747 high.
It seems like downsides could be limited by the $3000 support zone. There is a new connecting bullish trend line forming with support at $3000 on the hourly chart of BCH/USD. The trend line support is close to the 38.2% Fib retracement level of the last leg from the $2000 low to $3747 high. Therefore, any major dips from the current levels are likely to face bids near the $3200 and $3000 levels. A break below $3000 won’t be easy since the 50% Fib retracement level of the last leg from the $2000 low to $3747 high is at $2870.
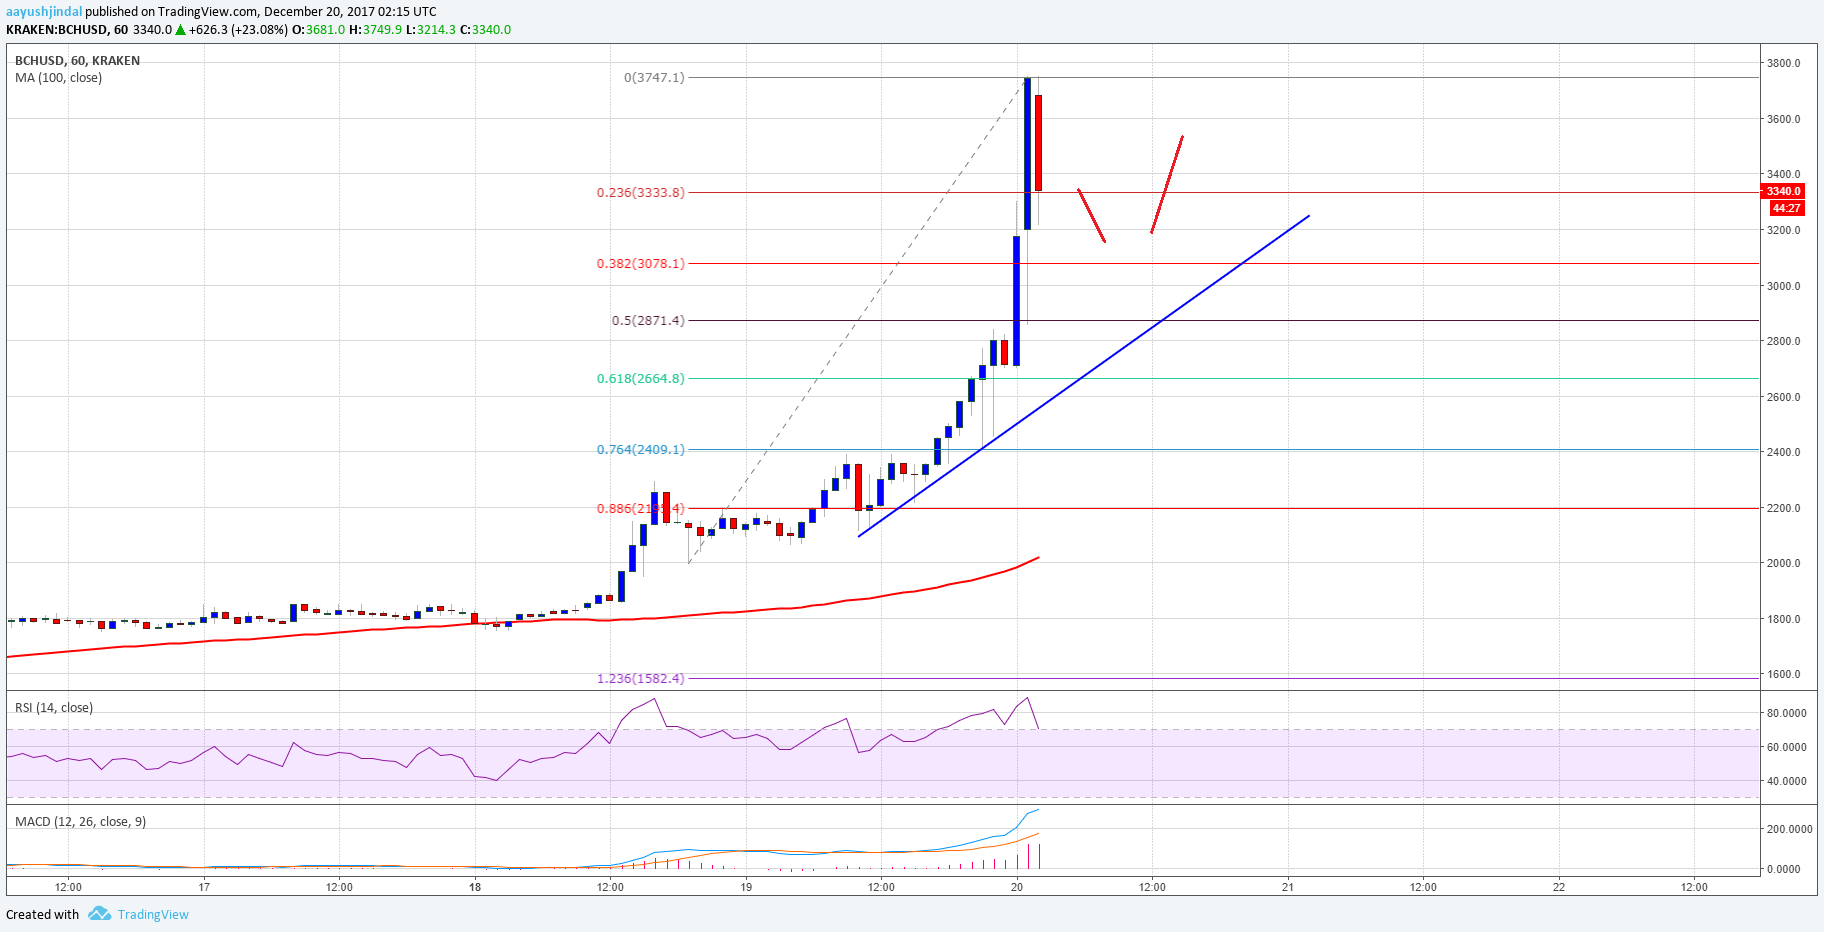
On the upside, the price may soon move above $3500. Should there be more gains above $3500, the price could test the $4000 level.
Looking at the technical indicators:
Hourly MACD – The MACD for BCH/USD is strongly placed in the bullish slope.
Hourly RSI (Relative Strength Index) – The RSI for BCH/USD is moving lower toward the 60 level.
Major Support Level – $3000
Major Resistance Level – $3500
Charts courtesy – Trading View, Kraken