Key Points
- Bitcoin cash price is currently recovering and is currently above the $900 level against the US Dollar.
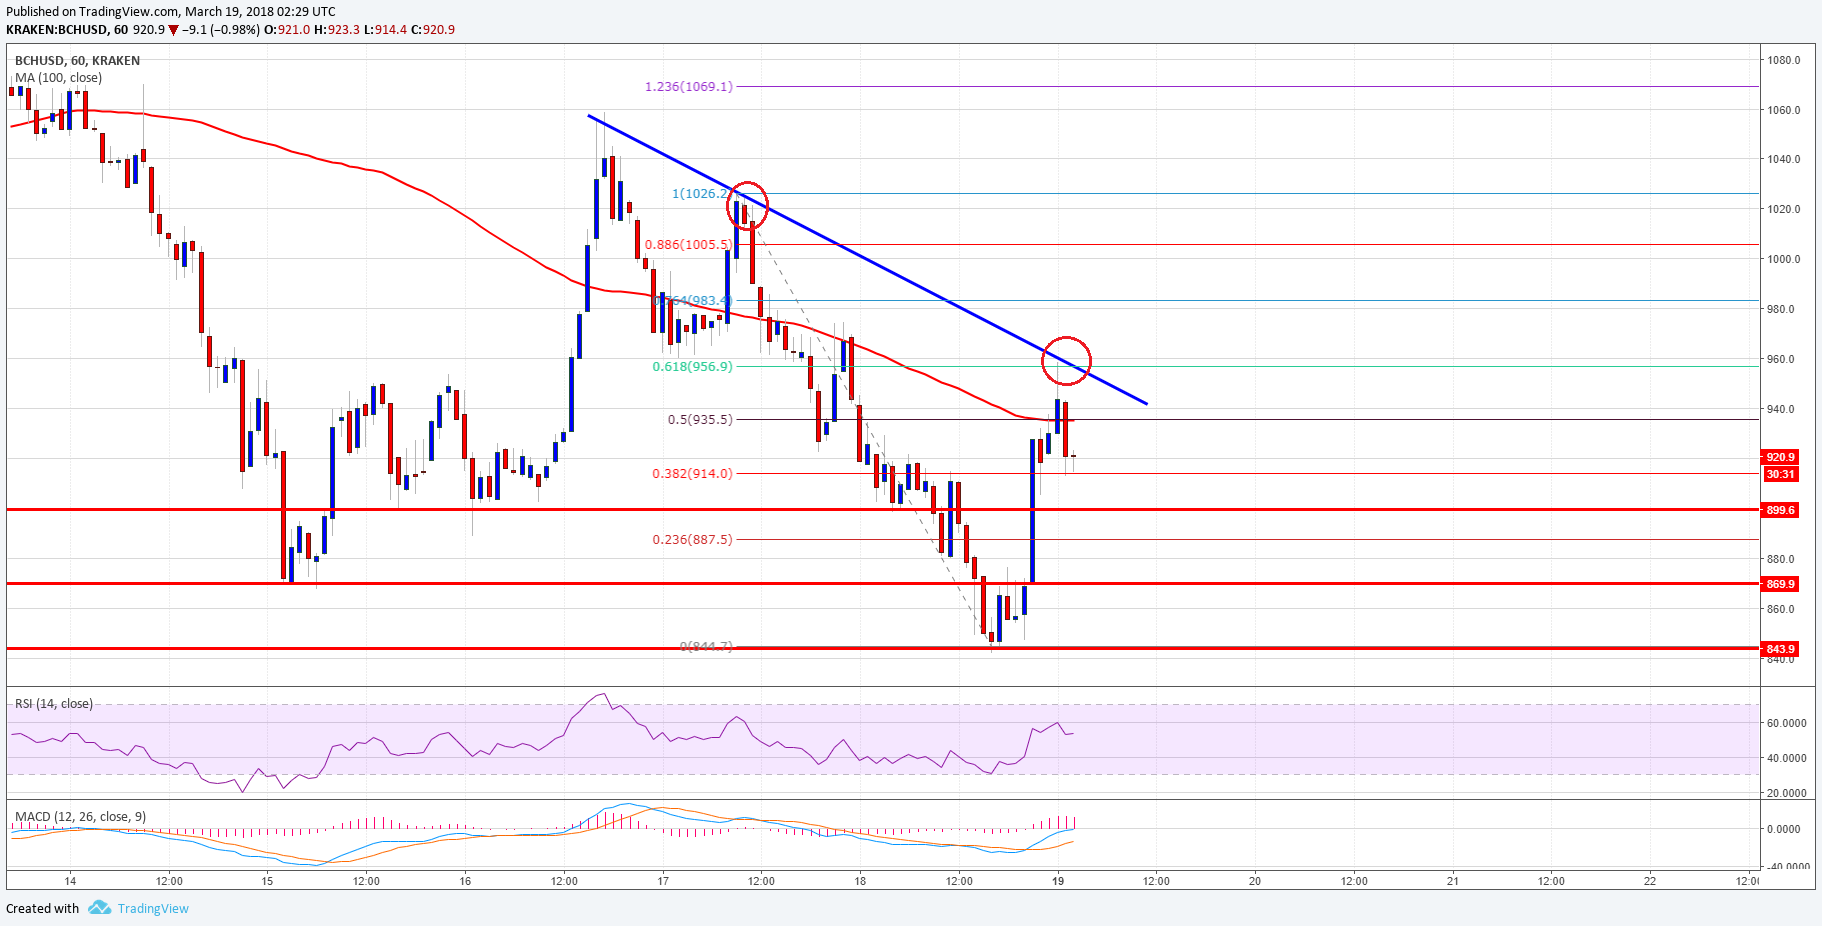
- There is a crucial bearish trend line forming with resistance near $955 on the hourly chart of the BCH/USD pair (data feed from Kraken).
- The pair has to break the trend line and resistance near $950-955 to trade further higher.
Bitcoin cash price is showing a few positive signs above $900 against the US Dollar. BCH/USD buyers must gain strength above $955 to push the pair further higher.
Bitcoin Cash Price Trend
There was a decent price action in bitcoin cash price from the $844 swing low against the US Dollar. The price started an upside move and it was successful in moving above the $900 level. There was also a break above the 50% Fib retracement level of the last decline from the $1,026 high to $844 low. However, there are many barriers on the upside for buyers around $950-960.
The current upside move was prevented by a crucial bearish trend line with current resistance near $955 on the hourly chart of the BCH/USD pair. Moreover, the 61.8% Fib retracement level of the last decline from the $1,026 high to $844 low. Furthermore, there was no close above $950 and the 100 hourly simple moving average. At the moment, the price is moving down and it could retest the $900 support. Below the mentioned $900 support, the next major supports are near $870 and $850.

On the upside, buyers must succeed in pushing the price above the $950 and $955 resistance levels. Above $955, the price could make an attempt or run towards the next major hurdle at $1,000.
Looking at the technical indicators:
Hourly MACD – The MACD for BCH/USD is slowly moving back in the bullish zone.
Hourly RSI (Relative Strength Index) – The RSI for BCH/USD is now well above the 50 level.
Major Support Level – $900
Major Resistance Level – $955
Charts courtesy – Trading View