

Bitcoin could retest the $13,000 range in the next two months, according to a macro technical indicator.
The cryptocurrency’s monthly chart shows that it was trending downwards inside a ‘Falling Wedge.’ It formed lower highs and lower lows, leading to the formation of a contracting price range. As it did, the monthly trading volume of bitcoin also dropped lower, as shown in the graph below.
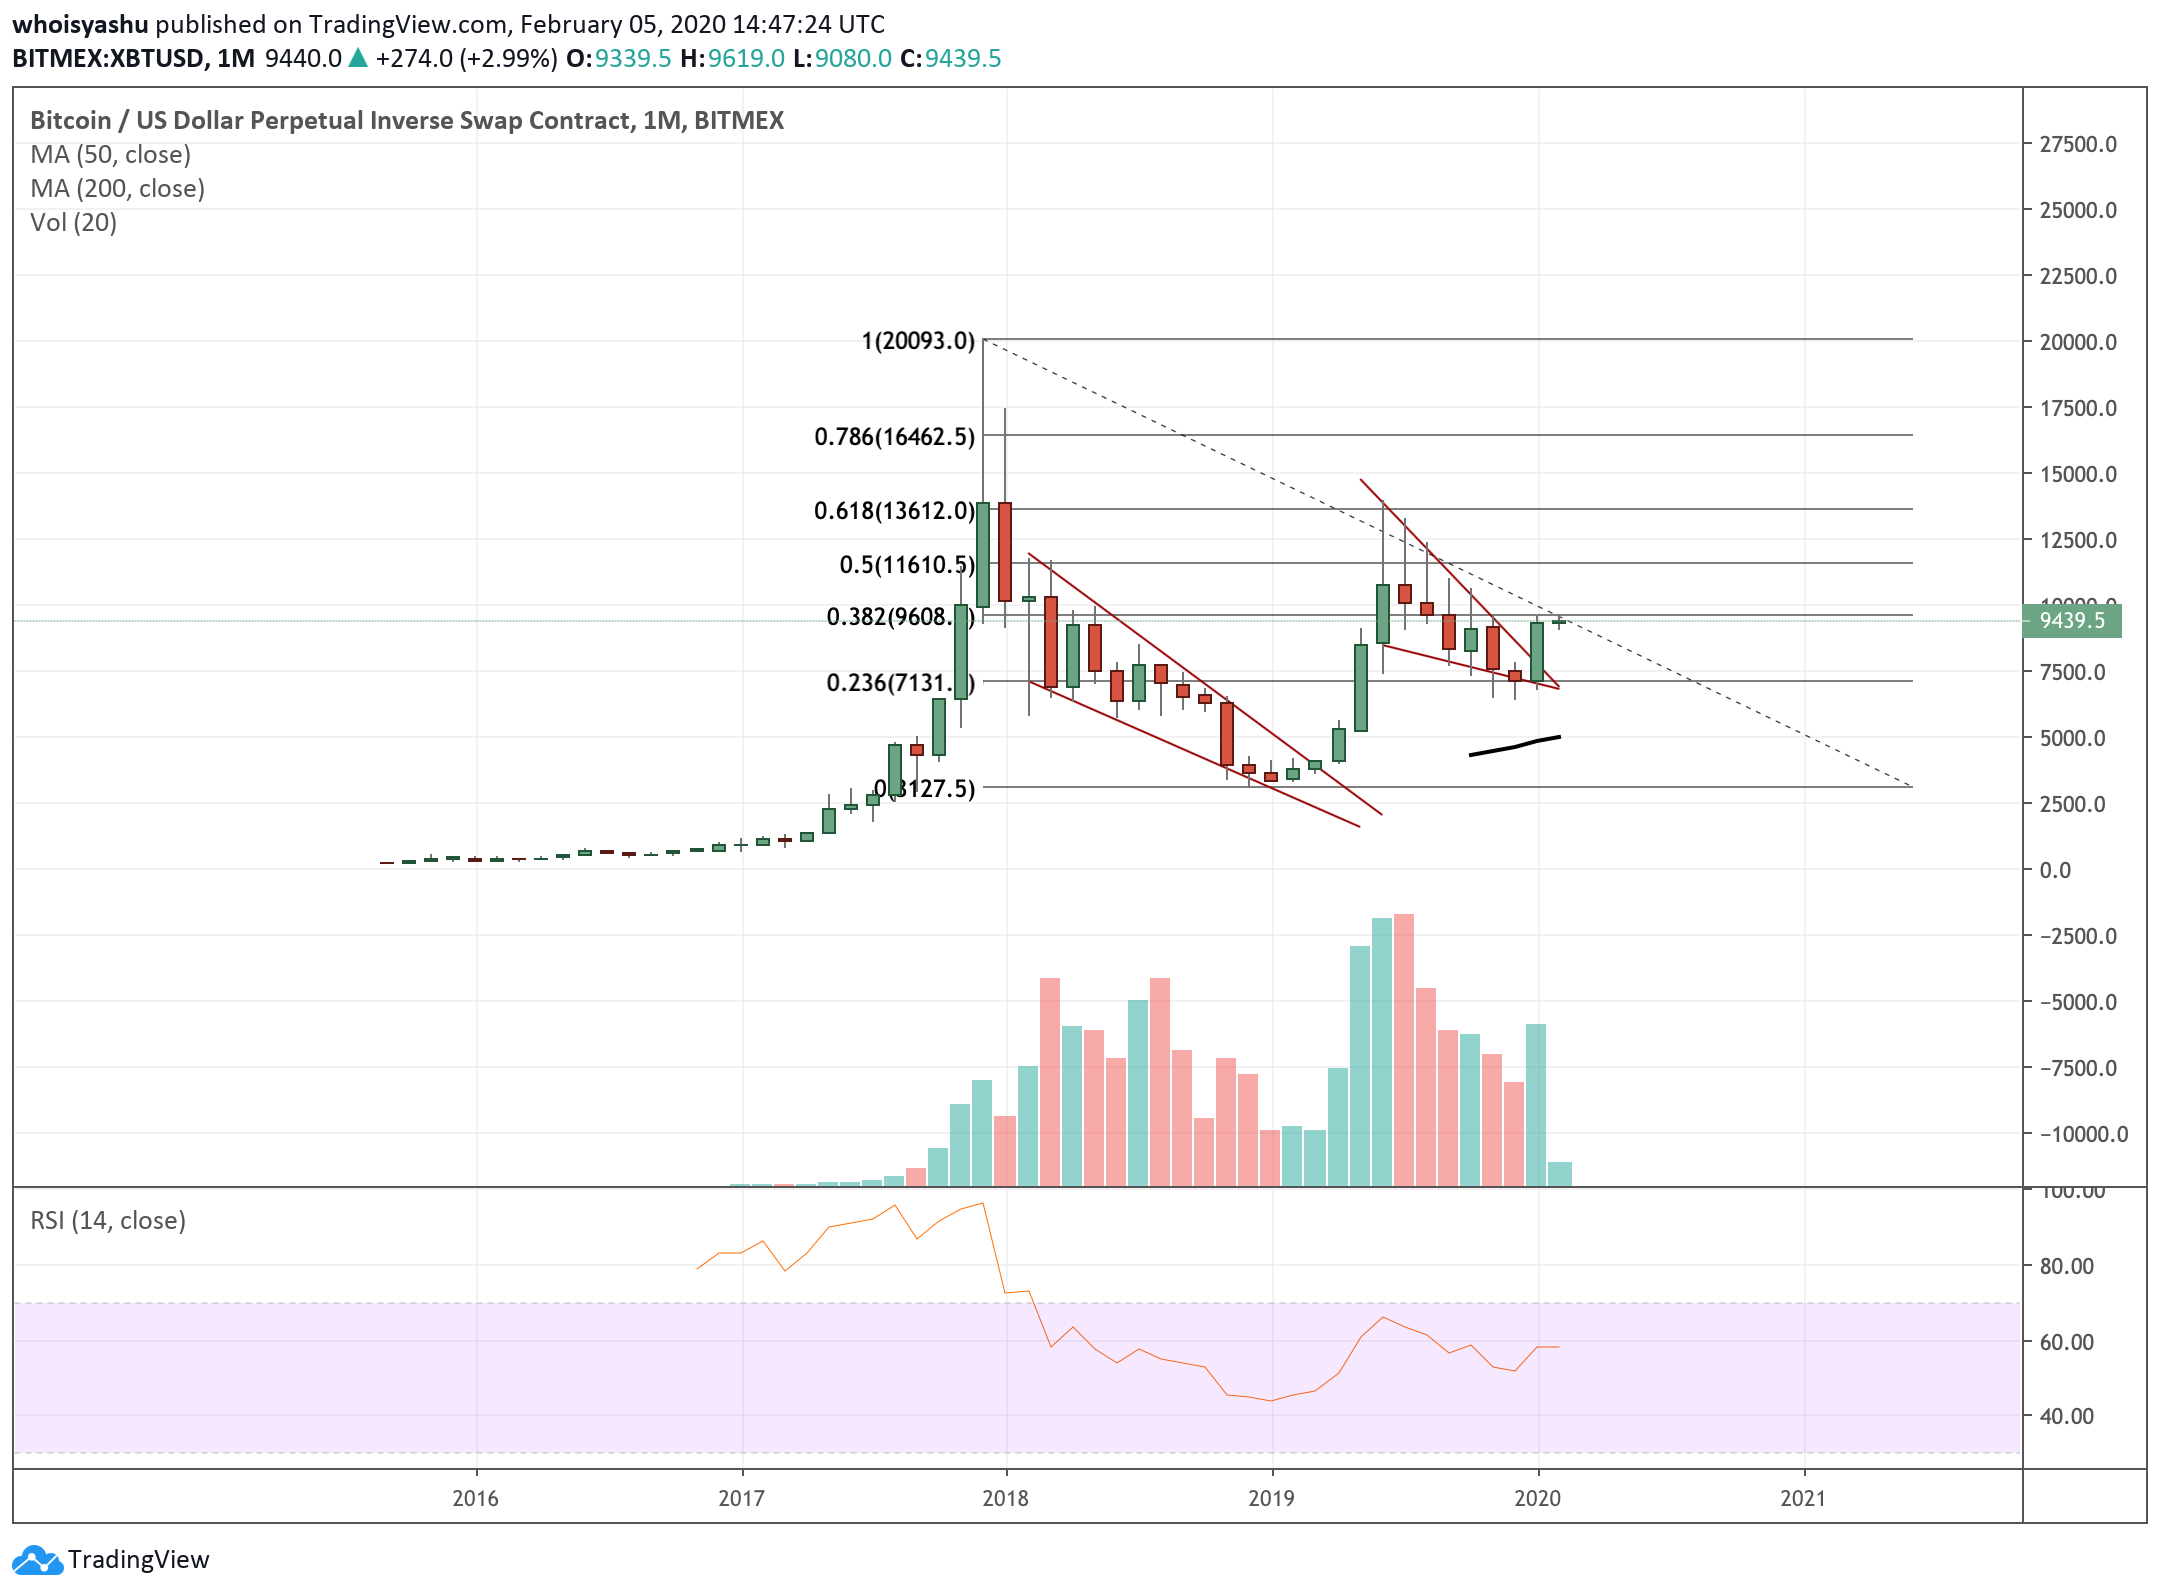
Heading into January 2020, the bitcoin price broke out of the Falling Wedge range. The move uphill came alongside a rise in trade volume, confirming a breakout.
Textbook definitions of the Wedge say that a breakout takes an asset’s price upward by as much as the height of the Wedge. In the current case, the maximum price gap between the upper and lower descending trendline comes to be circa $5,300. That said, bitcoin’s next upside is $5,300 above from the point of breakout.
Such a move could have the cryptocurrency test $13,000 by April 2020. That further coincides with the 61.8% Fib made on a retracement from $20,000-highs to $3,127-lows.
Interim Bearish Corrections Likely
Studying the same Wedge and retracement on a weekly chart introduces traders with potential pullback levels. As shown in the chart below, the bitcoin price is testing circa $9,600 as resistance.
The wall-like level has capped the cryptocurrency’s upside attempts from maximizing into breakouts in the October-November 2019 period. The same served as support when bitcoin was trending downwards in between July and September 2019.

So it appears, $9,600 is a key pivot that could confirm the XBT/USD’s ascent towards $13,000. Conversely, a pullback from the said level could have traders eye the blacked 50-weekly moving average wave as support. A further breakdown and the price would fall towards circa $7,100.
Meanwhile, if downside price corrections end up resulting in a red candle on the monthly chart, then the ongoing breakout would flip to become a fake-out, leaving possibilities of a wider breakdown towards $5,000-6,000 range.
Bitcoin Heading Towards $8,500
Narrowing down timeframes further leave bitcoin in a bearish position. The daily timeframe on the cryptocurrency’s future chart shows a gap near the $8,500-8,600.
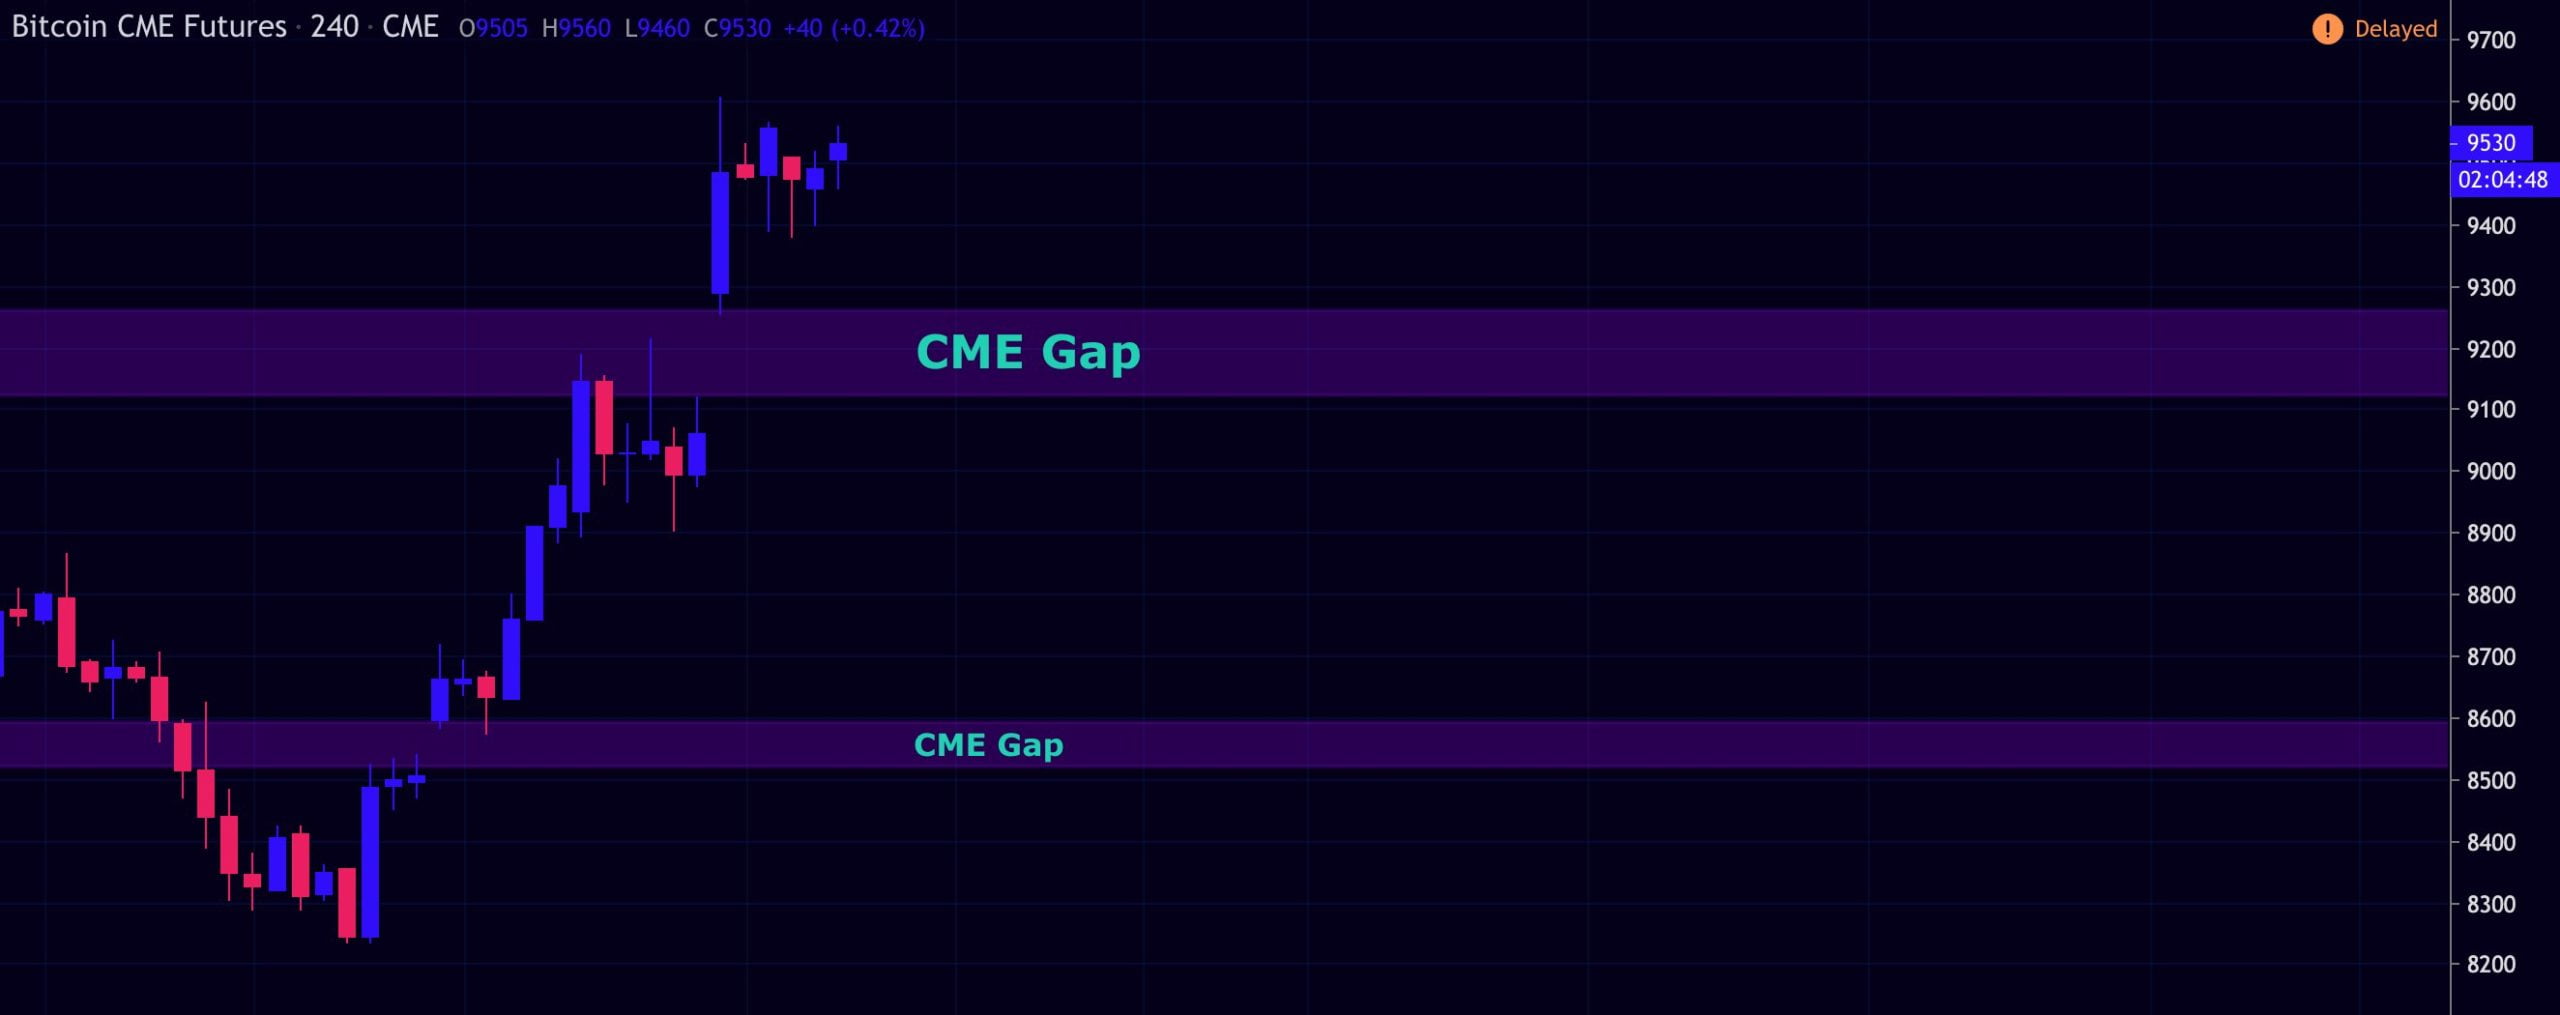
Historically, bitcoin’s spot rates follow the futures prices to fill the gaps – 95 out of 100 times, as NewsBTC covered earlier. That leaves day traders with little potential to maintain an interim bullish bias. Popular trader Mr. Whale further weighed his opinion on the matter, stating:
“Two CME Gaps spotted in the short term, which means we will be correct below $9,000 in the upcoming days. We will be correcting down to those ranges to fill up the gaps”
The analyst meanwhile added that “there will be better areas to long in the future.”