

Earlier today, we published our twice-daily bitcoin price watch analysis piece. In the piece, we highlighted some of the levels that we had been watching throughout Tuesday evening, and suggested what we felt might be the ones to watch as we headed into Wednesday’s session. Now action has matured throughout the European session, and we are heading in to the US afternoon, what are the levels we are watching, and did we manage to draw any profit from our scalp trades in the market today? Take a quick look at the chart.
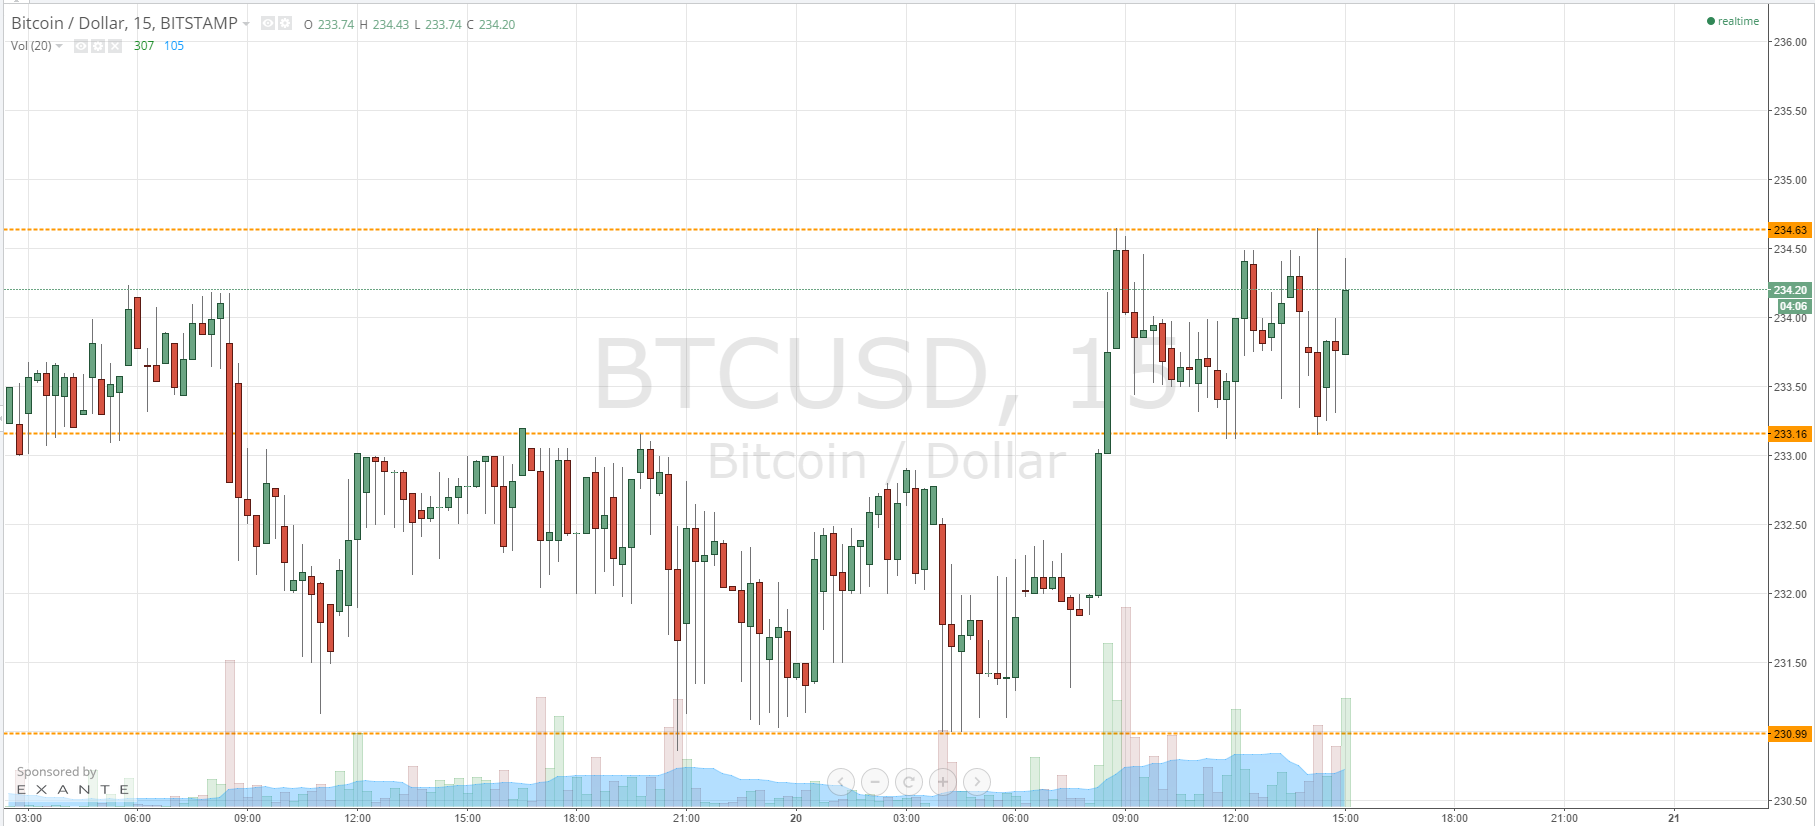
As the chart shows, shortly after we published our analysis, we got a test of support and an almost immediate run towards in term resistance. We broke above it, putting us long, and we hit our targets very quickly. Highs reached 234.63 mid morning (GMT), and this is now the level to keep an eye on to the upside (in term resistance). Looking to the downside, in term support sits at 233.16.
We are currently trading mid-range, so we will look for a break above 234.63 to put us long, with an initial upside target of 237 flat. On this trade, a stop loss somewhere around 234 flat will keep our risk to reward profile favorable.
Looking the other way, if we get some downside momentum, a break below 233.16 (in term support) will put us short towards the day’s lows at 230.99. We can afford a slightly wider stop on this trade, as our potential reward is slightly larger, so a stop loss somewhere around current levels – 234.5 would do nicely – will ensure that, if we do get a spike upwards or a return to trade within the range following a downside break, we are taken out of the trade for just a small loss and can easily recover.
Charts courtesy of Trading View