
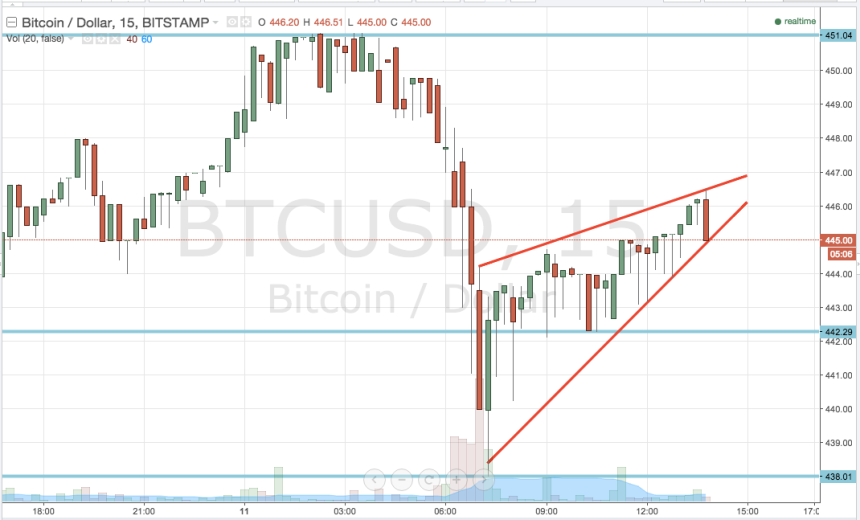
Its been a strange few days in the bitcoin markets. Having gained strength throughout the majority of last week, especially towards the end during which we got a kick up to fresh intraday highs, the bitcoin price dipped considerably throughout Saturday’s trading to register lows just ahead of 445, and despite a short term recovery that saw the bitcoin price break 450, continues to decline into Sunday’s trading. This decline saw lows carved out just ahead of 440 – a level that is going to feature in today’s price strategy. A look at the action today gives us a little bit of insight into how the bitcoin price might play out this going forward, with both a technical charting pattern forming to near completion and, as ever some key levels that we can bring into play on our breakout strategy. SO, with this in mind, let’s take a look at the levels in question, and try to figure how how we can apply our various strategies to any volatility in the markets today. We are circa mid afternoon in Europe, and so we only have a few hours’ worth of trading left in the European markets, but any framework we apply this afternoon will likely hold firm this evening, and beyond in to the Asian session. First then, get a quick look at the chart to see what we are watching.
As the chart shows, the key levels we are looking at today are in term support at 442.29 (as defined by a recent swing low) and in term resistance at 451.04. This is a pretty wide range, and so we can bring our intrarange strategy into play if action allows. For reference, in term support is defined by the over-the-weekend highs, and as such, should give us a nice break if we can close above it.
From a breakout perspective, we will look for a close below in term support to put us in a short trade towards an initial downside target of 438 flat. This is a short term scalp trade, so we’ve got to apply a pretty tight stop loss to the position. With a little over four dollars of reward available, a stop somewhere in the region of 444 flat gives us a tow to one risk reward profile and keeps things tight from a risk management perspective.
Looking the other way, a close above in term resistance will put us long towards 460. This is a bit more aggressive than the downside trade, giving us a little more space for our risk. A stop on this one at circa 448 looks good.
Intrarange, long at support (on a bounce) and short at resistance (on a correction), with a stop just the other side of our entry.
Regarding the pattern, as outlined in red, we’ve seen a upwards sloping triangle. This is often a bearish pattern, especially if it follows a downside break (as this one does). For the more aggressive trader, a close below triangle support (around 445 flat) could present a nice bearish opportunity towards 442 flat on a scalp, or 438 on a medium term short. A stop just above the pattern defines risk.
Happy Trading!
Charts courtesy of Trading View