

So in yesterday’s bitcoin price watch piece, we noted that action over the last week or so has been subdued in the majority of the financial asset markets as a result of the holiday season, and that the low volume we have seen in the bitcoin space suggests a mirroring of this trend. We also noted, however, that things seem to be getting back to normal this week, and we are likely to see some volatility going forward. We are currently mid way through the European afternoon, and the bitcoin price looks to be relatively unstable. As things stand, this makes it pretty tough to form a conclusive intraday bias. Having said this, there are a few things we can look at to try and gain some insight into the likely action throughout the rest of today’s session and as we head into tonight’s Asian action. So, with this said, let’s take a look at our different strategic approaches, and see which of them works best as a response to any movement we get going forward. As always, take a quick look at the chart below to get an idea of what today’s key levels are, and where they fit into the grand scheme of intraday action.
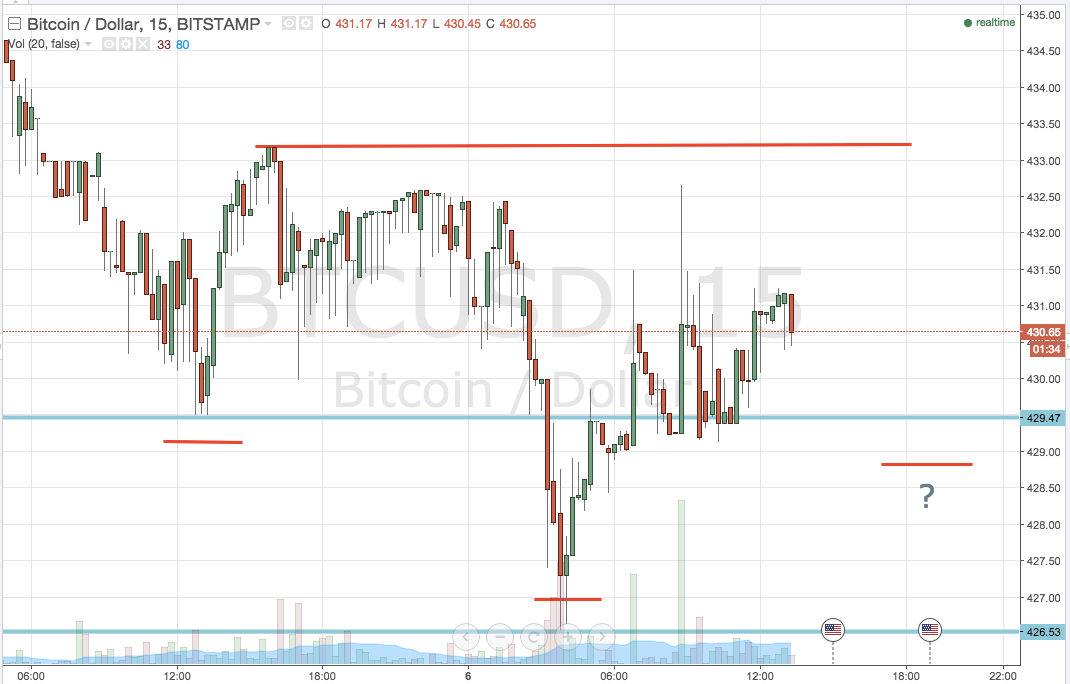

As the chart shows, we are looking at a combination of traditional in term support and resistance this afternoon, while also noting the potential for a medium term reversal on the completion of a classical charting pattern. We will look at the pattern shortly, but first let’s address our range. In term support sits at the most recent swing lows at 429.97, while in term resistance comes in at 433.25 (as illustrated by the red trend line). These two levels define today’s range.
From a traditional breakout strategy perspective, then, we will look for a close above in term resistance to validate an immediate upside entry towards a target of 440 flat. This gives us a reasonable amount of room to play with from a risk management perspective, and a stop in the region of 432 flat looks valid.
To the downside, a break below in term support at 429.47 will put us short (assuming we close below this level) towards a short term target of 426.53 – intraday lows. This is a scalp trade, and so a much tighter stop is warranted than was on our long entry. With this in mind, somewhere in the region of current levels – 43.65 – should do the trick.
Now to the pattern. A classical head and shoulders forms when we see a peak, trough, higher peak, trough then a peak equal to the size of the first. When price breaks through the neckline of the pattern (normally the troughs’ lows) the pattern validates a short entry. The inverse version (what we have in todays action) is a reversal pattern and suggests we could be coming to an end of the overarching bearish bitcoin price momentum. The pattern is so called because it represents a head and shoulders (in the classical sense) and an upside down version of said, in the inverse sense. The upside down head and shoulders is marked in red. If price reaches today’s in term support, and bounces, we will look for a break of the neckline (today’s in term resistance) to put us long towards a target equal to the distance from neckline to head – in this instance about $17, so a target on the break of about 450 flat.
Charts courtesy of Trading View