

A look at the bitcoin price overnight on Tuesday shows a sharp decline in the session, and sets us up for some further volatility today. As we’ve mentioned a few times last set of bitcoin price watch pieces, action has been relatively muted during the European session for sometime. However, when we get a sharp move like that which we saw last night, the likelihood is that the volatility will continue through to at least the early parts of the day, meaning that could be some opportunity for a profit from the market if we line up against any action with the correct levels today. So, with this said, what of levels that were keeping an eye on in the bitcoin price this morning? Take a quick look at the chart.
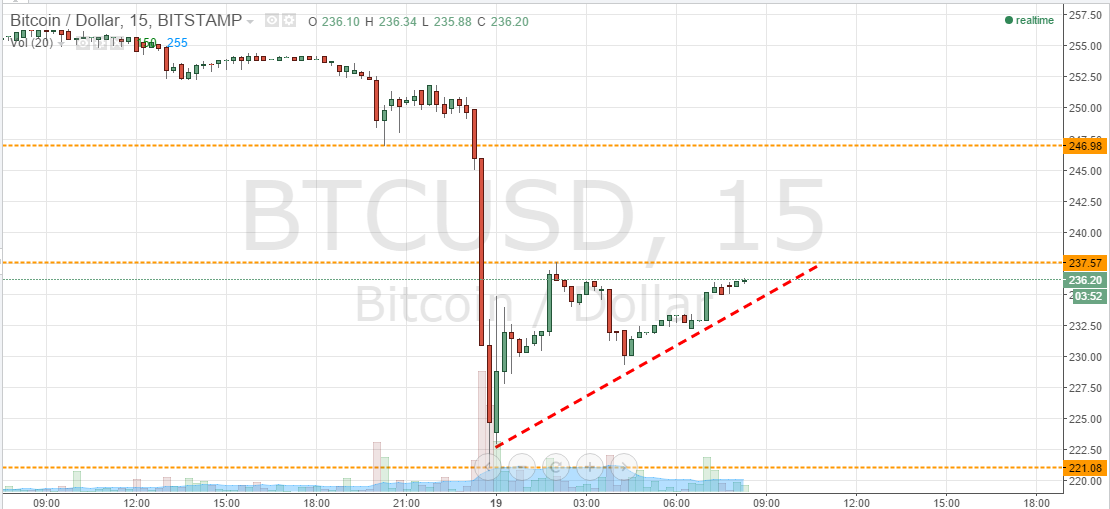

As you see, action decline overnight floors of 221.08, quickly recovered to intraday highs of 237.57, and have since traded against an upward sloping trendline between these two parameters. These are going to be to keep an eye on today (at least early on), with the former 221.08 serving as in term support, and the latter 237.57 bringing us in term resistance for the day.
Chances are – especially in light of the upward sloping trendline – that we will get a break of 237.57 initially. If we do, we could look to medium-term upside target of 246.98. However, we must be aware that the upward sloping triangle that is forming on the 15 minute chart is the traditional bearish pattern in other asset charting, so a break below the trendline somewhere around 236 would put us short towards in term support at 221.08. With the levels well-defined, we can set up a nice stop loss on this one, so somewhere around 240 should leave plenty of room to draw profit from what would be quite a long-term trade whilst maintaining a positive risk reward profile on the setup.
Charts courtesy of Trading View