

Earlier this morning we published our twice-daily bitcoin price watch piece. In the piece, we highlighted levels that we were keeping an eye on bitcoin price throughout Tuesday’s session, and suggested how we would respond to price reaching these levels as far as entering according to our intraday scalp strategy was concerned. Now, as action has matured throughout the European session and we head into a fresh Asian morning, what are the levels that we are going to be watching in the bitcoin price tonight, and where will we be looking to draw profit if we reach or break these levels? Take a quick look at the chart.
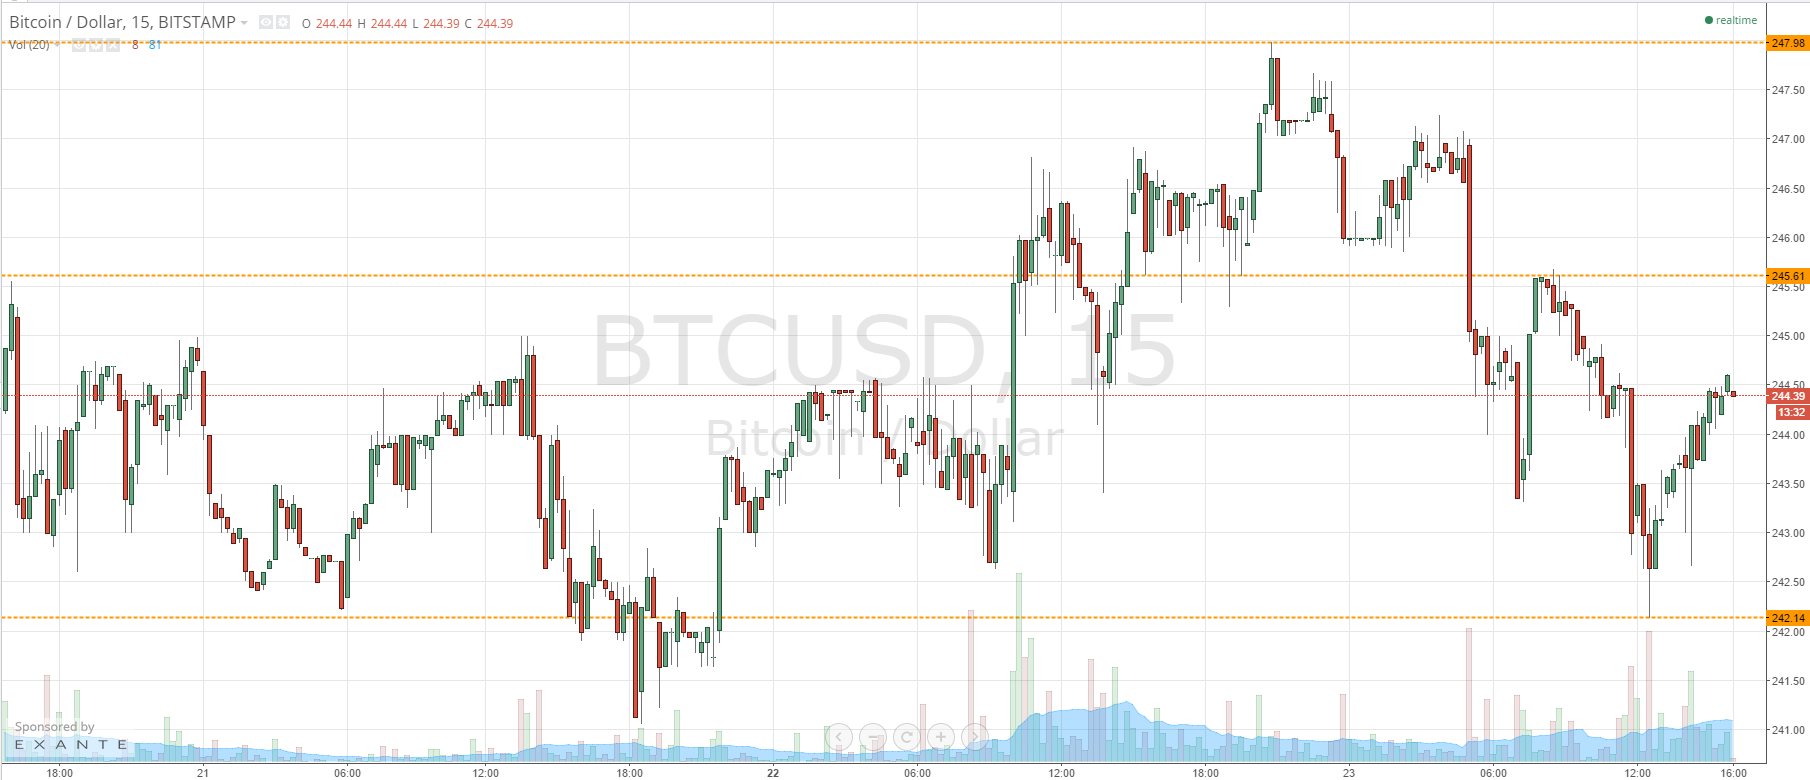
As the chart shows, the head and shoulders pattern we highlighted this morning has since completed and we have seen some considerable downside momentum in the value of bitcoin versus the US dollar. The new levels that we are watching this evening are in term support at 242.14 and resistance at 245.61. We are currently trading mid-range, so we will initially look for a 245.61 break to validate an initial upside run towards 247.98. On this trade, a stop loss somewhere around current levels (244.50) will maintain a positive risk reward profile on the trade.
Looking the other way, if we continue with the bearish momentum and we get a run down towards 242.14, we will look for a break below this level on the 15 minute candlestick chart to bring 239 flat into play as an immediate downside target. Once again, a stop loss somewhere around current levels (or maybe a little below) around 243.5, will ensure that we are taken out of the trade in the event of a bias reversal yet will also give us just enough room to survive a chop out on a return to trade within range in case we get some volatility.
Charts courtesy of Trading View