

The bitcoin price has given us a tough time over the last few days. Having peaked out just short of 320 on Sunday, and declining considerably to around the 280 mark on Monday, we saw some pretty flat action throughout the first half of this week and expected (not least because of a number of fundamental risk-off drivers) bitcoin to recover before we headed into this coming weekend.
However, things have not turned out this way, and the sideways action seems to have given way to some bearish momentum during last night’s Asian session. So, with this said, what are the levels that we are keeping an eye on today in the bitcoin price, and how can we try and get in and out of the markets according to our intraday scalp strategy? Take a quick look at the chart.
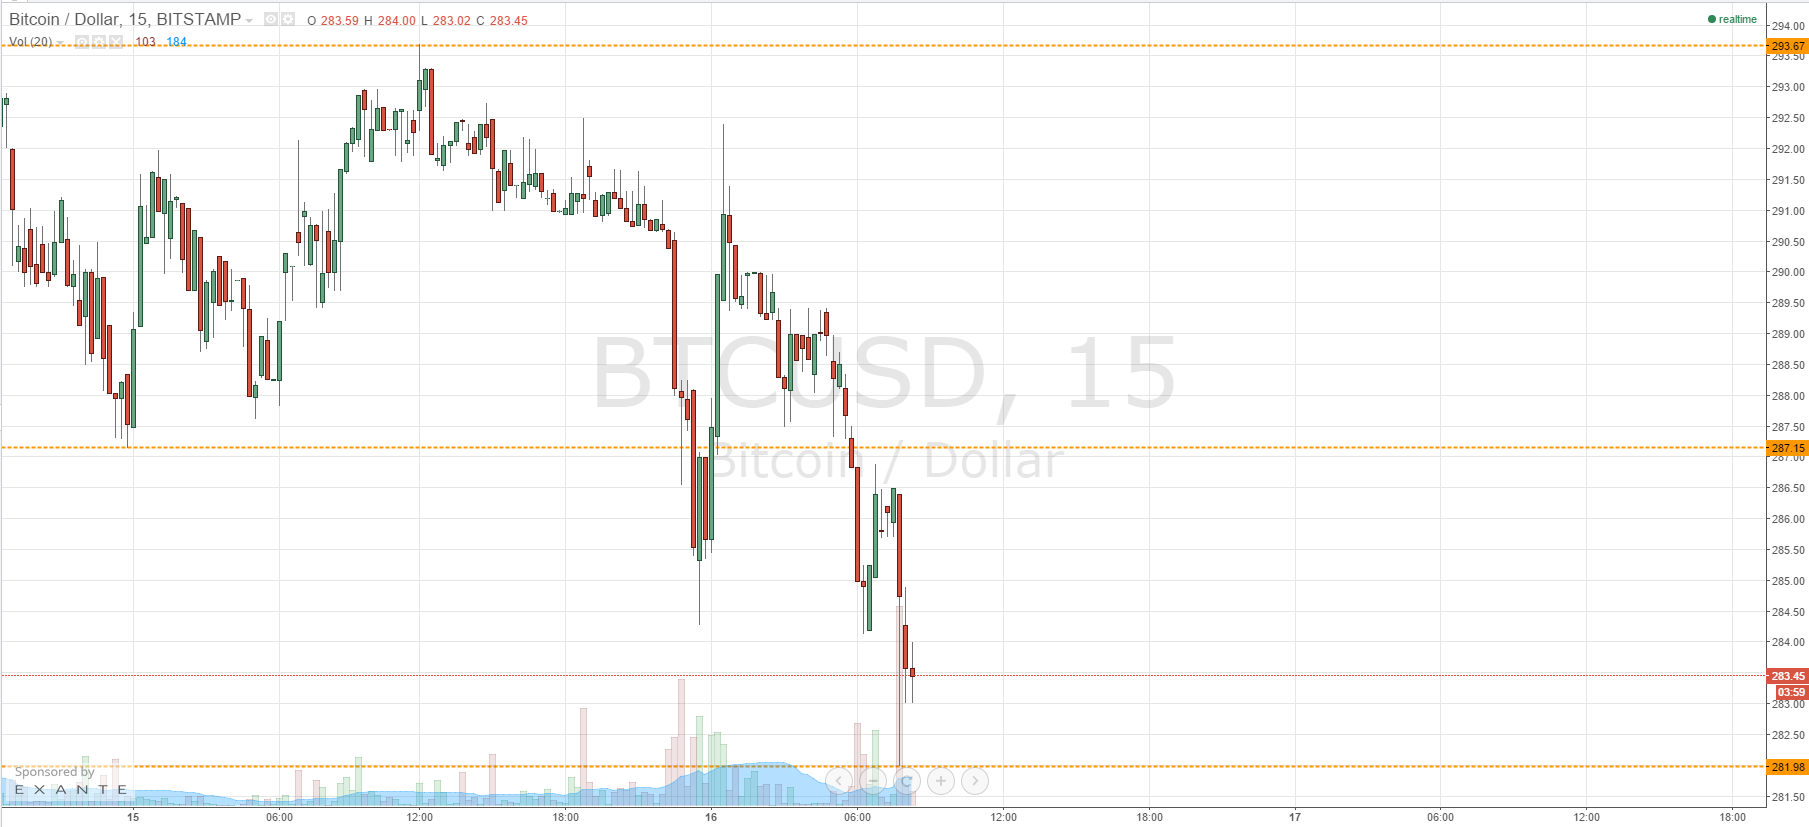
At the chart shows, action overnight has seen the bitcoin price break to what serves as intraday lows and in term support concurrently, around 281.98. This is the level that we will be watching to the downside during today’s session. To the upside, 287.15 brings us in term resistance, having served as a key support level over the past few days on numerous occasions. To the upside, this is the one to watch.
With the current momentum seemingly bearish, we will first address a short entry. If we can close below aforementioned in term support (281.98) it will put us short towards a medium-term downside target of 275 flat. A stop loss somewhere around 283.4 (current levels, coincidentally) will help us to maintain a positive risk reward profile on this trade.
Looking the other way, if we get a bounce from in term support, an aggressive long entry could be towards in term resistance with a stop loss just below 280 flat, and a target of 287.15. Further to this, if we get a break above 287.15, it will put us long towards 293.67 with a stop around 286 flat keeping the trade attractive from a risk management perspective.
Charts courtesy of Trading View