On Friday evening, shortly before the markets close in Europe, we published our twice-daily bitcoin price watch piece. In the piece, we highlighted levels that we would be keeping an eye on throughout the weekend in the bitcoin price, and suggested where we would look to get in and out of the market according to our intraday bitcoin price breakout strategy was concerned. Now action has matured, and as we head into a fresh week’s worth of trading in the bitcoin price, what of levels that were keeping an eye on, and where will we look to draw profit today? Take a quick look at the chart.
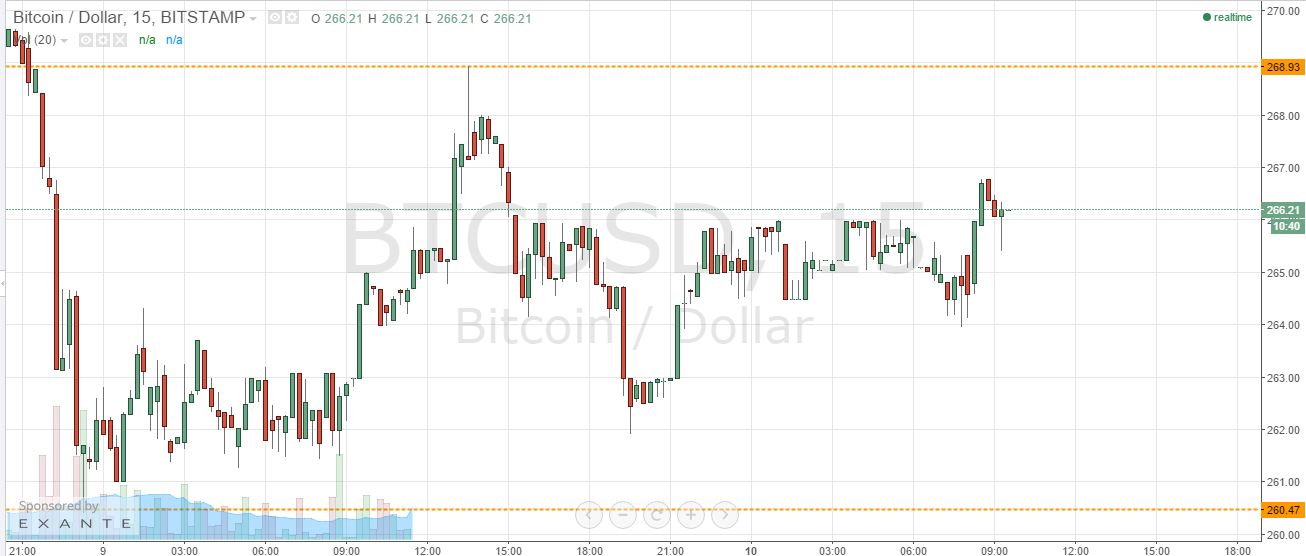

As you see from the chart, action in the bitcoin price was pretty rough over the weekend. We declined very sharply throughout Saturday session from levels just shy of 280 flat to over the weekend floors of 260.47. Having reached these floors, we corrected somewhat to reach 268.85 mid-afternoon on Sunday, but has since traded back down to currently reside within the parameters of those to aforementioned – which serve as in term support and resistance respectively today.
We will first look for a break above 268.85 (in term resistance) to validate a short-term bullish bias towards 272 flat. Quite a tight trade this one, purely because of the recent action we have seen, and so a stop loss somewhere around 267 flat is valid.
Looking the Other way, a break below 260.47 would bring 255 flat into play medium-term. A stop loss somewhere around 262 flat will help us to maintain a positive risk reward profile on this trade.
For the more aggressive trader, intra-range strategy to be employed. Short of 268.85 with a stop loss somewhere around 271 or long at 260.47 with a stop loss somewhere around 258 towards the opposite levels respectively.
Charts courtesy of Trading View