A little earlier on this morning, we published our twice-daily bitcoin price watch analysis piece. In the piece, we highlighted the levels that we would be watching throughout Wednesday’s session, in the hope that we could draw a profit from the bullish momentum we have seen in the bitcoin price as late. As it happens, we did get a break out, but we have now returned to trade within the range that we had slated as the one to watch this morning, and it looks as though we may see a temporary reversal of the current action. So, with this said, what are the levels that we are keeping an eye on now, and how might we respond to price action over the coming Asian session? Take a quick look at the chart.
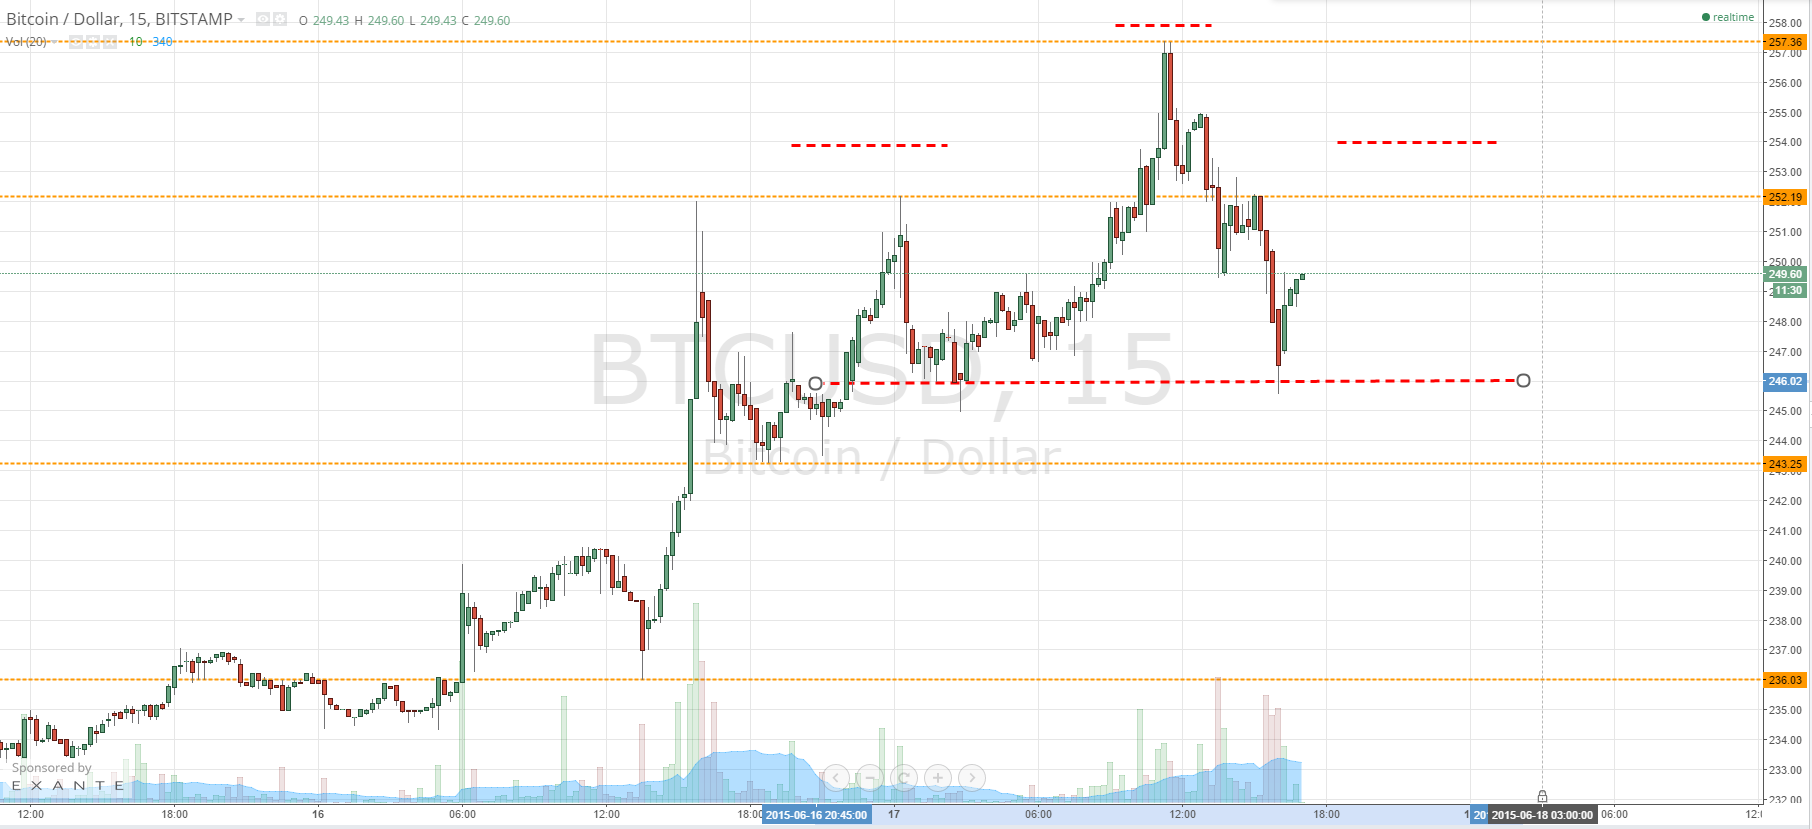
As the chart shows, we broke through in term resistance at 252.19 to reach intraday highs of 257.36. The upside run hit our target (placed at 255 flat on the breakout) and took us out of the trade for a nice profit. However, from the highs, we have since corrected and now trade around 249 flat, just shy of the in term resistance we broke this morning. If we can get a break back above resistance, it would once again put us long, this time with an intraday target of aforementioned daily highs at 257.36. However, as also highlighted the chart, we may see a head and shoulders pattern form tonight. This is a traditional charting pattern, and can often suggest a bullish run is coming to an end. If the right “shoulder” forms tonight, look for a breaking of the neckline (highlighted around 246 flat) to suggest some bearish momentum and put us short towards 236.03 as an initial downside target. Even if the shoulder does not form, a break below 243.25 (in term support) will do the same as far as putting us in a short position is concerned. A stop loss on the short position around 245.5 will maintain a positive risk reward profile when considered against our downside target.
Charts courtesy of Trading View