

Bitcoin price started rising today to print a high that is a few cents short of $328 on Bitstamp. Since the 17th of November, bitcoin price has been dropping and scoring lower lows each day, on most of the past 10 days. Nevertheless, the downtrend seems to have started fading already, especially with the completed Elliot 5 Wave pattern that we can spot on the 1 hour charts.
5 Elliot Waves On the 1 Hour Charts:
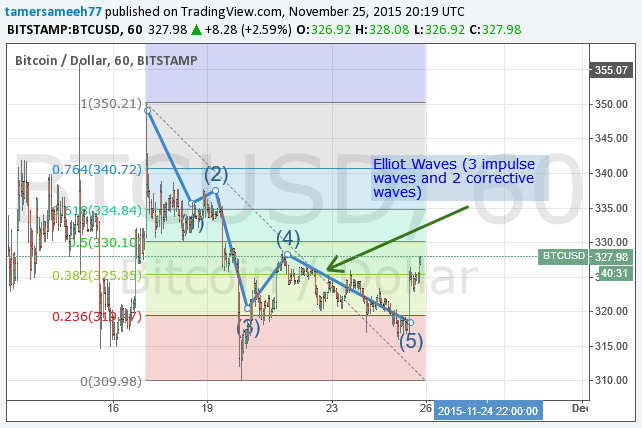
By examining the 1 hour (BTC/USD) charts from Bitstamp (look at the below chart), we can notice the following:
- We can now plot a Fibonnaci retracement between the high printed on the 17th of November ($350.21) and the low scored on the 20th of November ($309.98). Accordingly, bitcoin price is now approaching the resistance at $330.10 which corresponds to the 50% Fib retracement level.
- A 5 Elliot wave pattern can be spotted controlling the market during the past 8 days (The blue zigzag wave on the below chart). The pattern is composed of 3 bearish impulses (1, 3 and 5) and 2 bullish “rollbacks” (2 and 4). The pattern has just been completed a few hours ago, before the price started rising. The downtrend is highly likely to reverse after completion of an Elliot Supercycle, so we can expect to see bitcoin price break the $330.10 resistance level within the next few days.

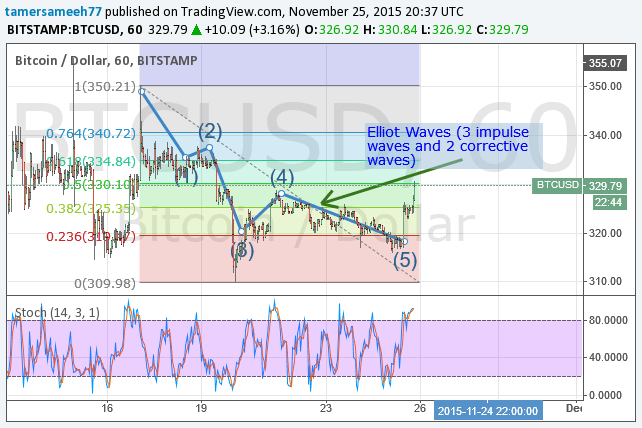
Stochastic Oscillator – Bitcoin Overbought
The below chart is the same 1 hour (BTC/USD) Bitfinex chart with the Stochastic oscillator added showing a level of 94 which means that bitcoin is overbought, so I would not recommend investing in long positions until the stochastic level drops below 80.
If bitcoin price breaks through the $330.10 level with a stochastic value below 80, a long position could be opened with a convenient risk/reward ratio with take-profit set at $334 and $340 respectively.
Conclusion:
Bitcoin price rose to a high of around $328 earlier today. After an Elliot Wave Supercycle has been completed, a reversal of the downtrend is expected, yet investing in long positions should be withheld until the stochastic oscillator value falls below 80.
Charts from Bitstamp, hosted on Tradingview.com