

Bitcoin Price Key Highlights
- After spending weeks sitting pretty inside a tight consolidation pattern, bitcoin price is finally getting back on its feet and showing some momentum.
- A downside breakout from the ascending triangle pattern and short-term pennant formation appears to be taking place.
Bitcoin price could be in for more downside now that a long red candle has closed below the ascending triangle support at $330.
How Low Can It Go?
Bitcoin price could have its sights set on the bottom of the triangle pattern near the $300 major psychological level as its target for the selloff. Before further declines take place though, price could still pull up to retest the broken triangle support.
The 100 SMA crossed above the 200 SMA briefly but looks ready to make another downward crossover, indicating that further downside is to be expected. Stochastic is on the move down but is already nearing the oversold region so a bit of profit-taking might be possible soon.
RSI is also heading south, indicating that bearish pressure is present. Once the oscillator reaches the oversold area and turns higher, bulls might still take control and push for a move up to the triangle resistance near $340. Sustained buying pressure might even lead to a pop higher that could show the downside break was a fake out.
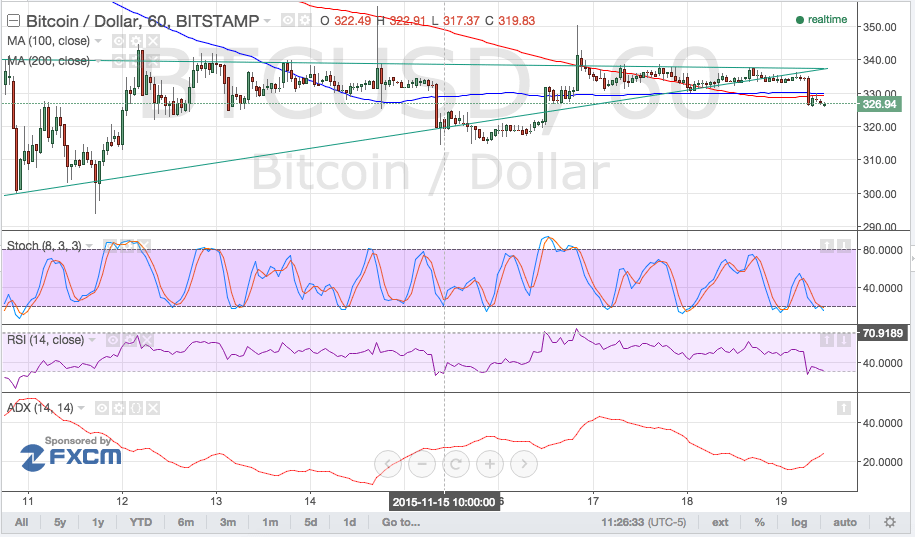

The average directional index is starting to make its way up to the 50.0 level, possibly indicating a return to trending market conditions. If bearish momentum stays in play, this could be a signal that a longer-term downtrend is underway.
For now, bitcoin price could target the next near-term floor around the $320 area of interest. This level has acted as resistance then support, likely spurring a quick bounce when price reaches it soon.
Intraday support level – $320
Intraday resistance level – $340
Technical Indicators Settings:
- 100 SMA and 200 SMA
- Stochastic (8, 3, 3)
- RSI (14)
- ADX (14, 14)
Charts from Bitstamp, courtesy of TradingView