

Yesterday evening, shortly before the markets closed in the UK, we published our twice-daily bitcoin price watch analysis piece. In the piece we highlighted the levels that we would be keeping an eye on in the bitcoin price as it matured throughout the Asian session and overnight in Europe, and suggested how we might respond to price reaching a couple of key break points. Now, as we head into a fresh European session, what are the levels that we are watching in today’s bitcoin price, and where will we look to get in and draw a profit from the market according to our intraday scalp and breakout strategy? Take a quick look at the chart.
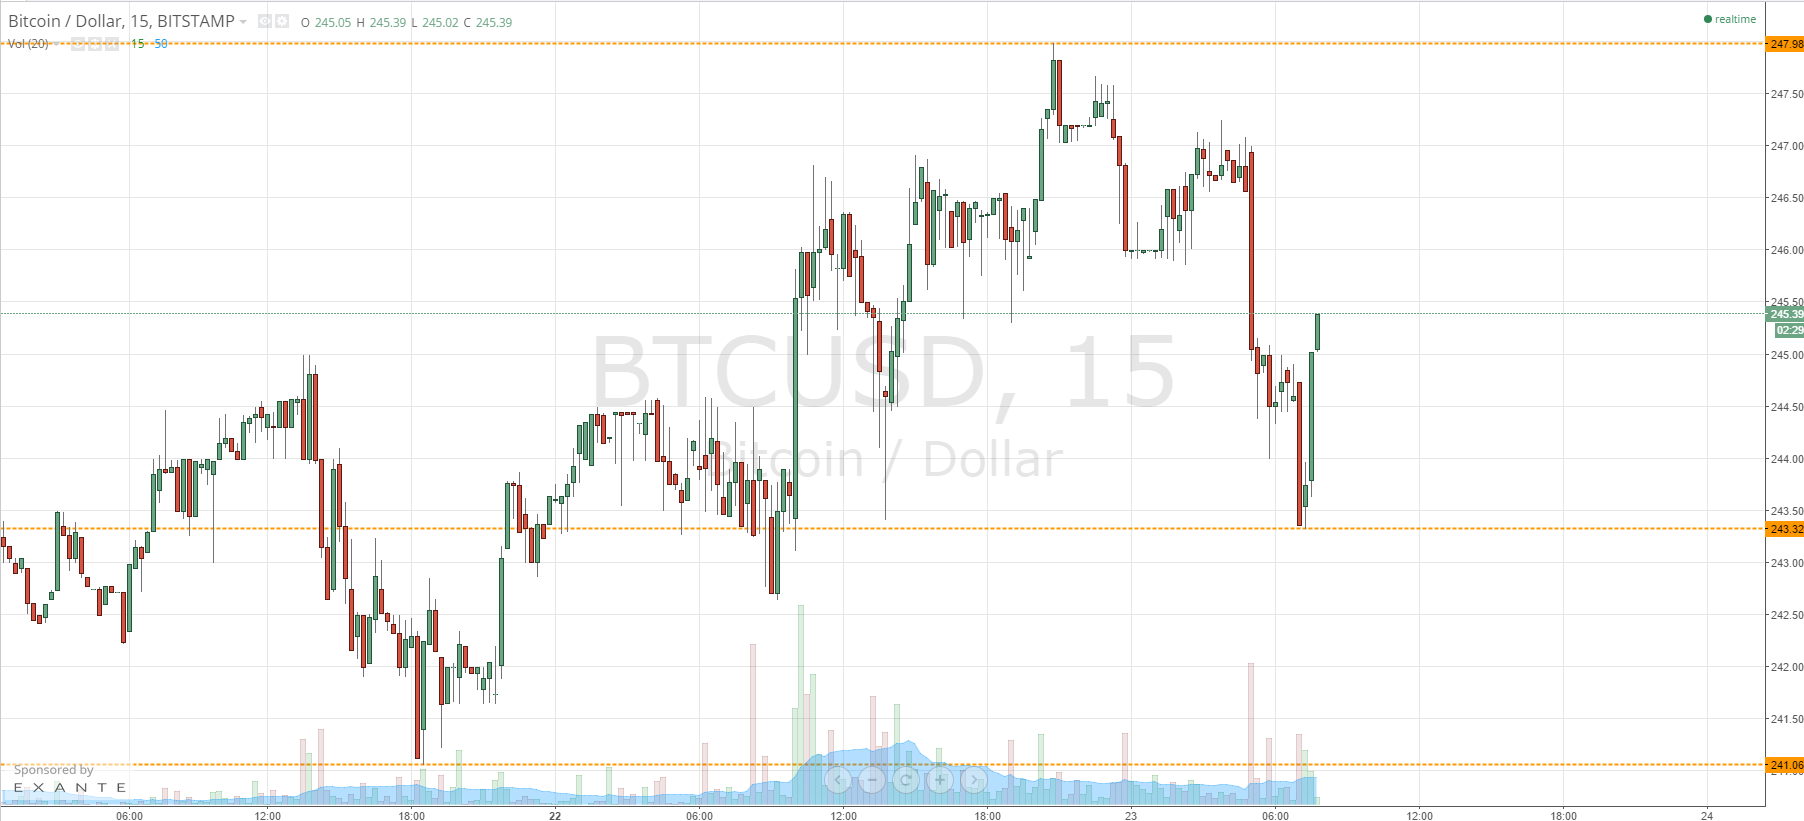
As the chart shows, overnight we got a similar head and shoulders pattern as we saw late last week, with intraday highs topping out at 247.98 before correcting to bounce from support short-term and then breaking back through the neckline of the pattern to daily lows of 243.32. These are the two levels that we are going to be keeping an eye on today. If we can get a break below 243.32, it would present 241.06 as an immediate downside target. A stop loss somewhere around 244.5 will maintain a 2 to 1 risk reward profile on trade and take us out in the event that we return to range.
Looking the other way, a break above 247.98 would validate 251 flat to the upside, with a stop loss somewhere around 246.5 once again making the trade attractive from a risk management perspective.
For those looking for a more aggressive option, if we get a run back down towards support at 243.32, and a bounce, a long entry towards in term resistance with a stop loss somewhere around 242 looks like a nice intra-range trade, with the opposite being true with a correction from resistance and a target of 243.32 to the downside.
Charts courtesy of Trading View