Late yesterday afternoon, shortly before the European session drew to a close (GMT) we published a piece highlighting the day’s action in the bitcoin price, and offering up a number of key levels that we were looking to in order to gain some insight into a potential overnight bias. We suggested that a break of either in term support or resistance would offer up a bearish or bullish bias respectively, and noted the targets we would look to in the event of such a bias being signalled. This said, what I see happening overnight, and what are we looking at today? Take a quick look at the chart.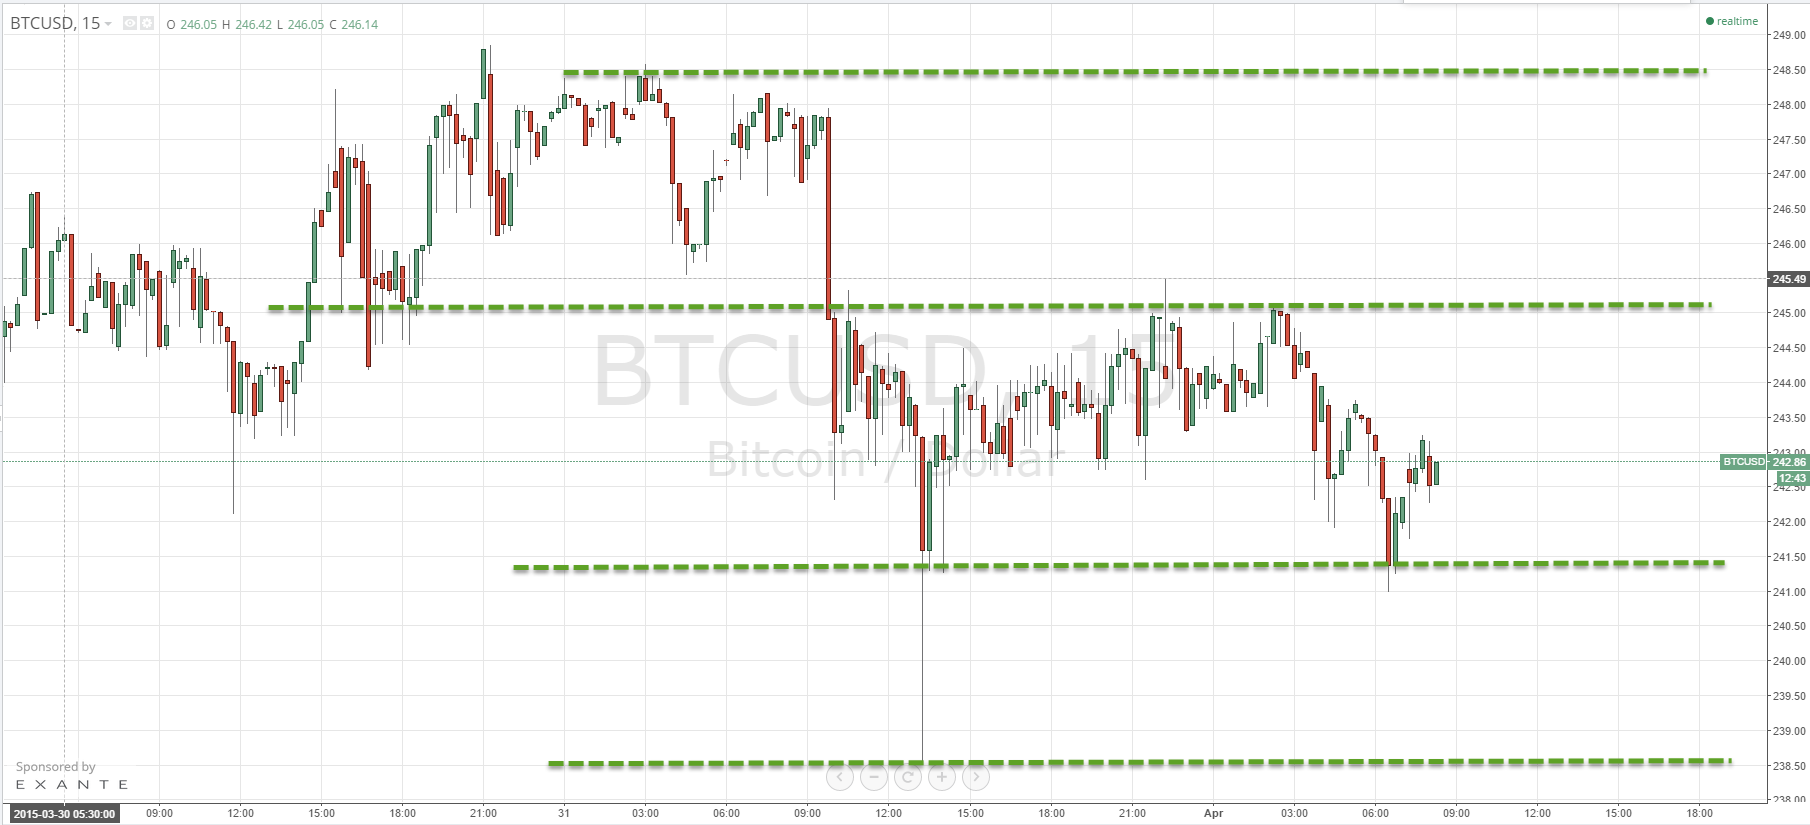
As the chart shows, instead of breaking out of its range, we simply saw the bitcoin price trade sideways throughout the European nighttime, in between what now serves as in term support at 241.5 and resistance at 245.0. These are the levels that will be watching from the outset of the UK open and beyond.
We may continue to trade sideways early session, but if we do get a break we will enter according to its bias and look to the outer reaches of the weekly highs and lows as our initial respective targets. A break below 241.50 would signal a short entry with an immediate target of 238.5. A stop just shy of 242 will take us out of the trade for a small loss in the event that we get some unexpected fundamental development in the digital currency space.
Looking the other way, if support holds and we get a run towards in term resistance, a break above 245.0 would signal a long entry with an immediate upside target of 248.50. Once again, a well-placed stop loss (somewhere just shy of 244.5) keeps our risk tight when compared to the potential gains.
Charts courtesy of Trading View