

Earlier this morning we published our twice-daily bitcoin price watch piece, and highlighted a couple of key levels we were keeping an eye on in the bitcoin price throughout the day. Now action has matured throughout Thursday, what are the levels that we are keeping an eye on this evening, and what will we be looking for to put us either long or short in a trade? Take a quick look at the chart.
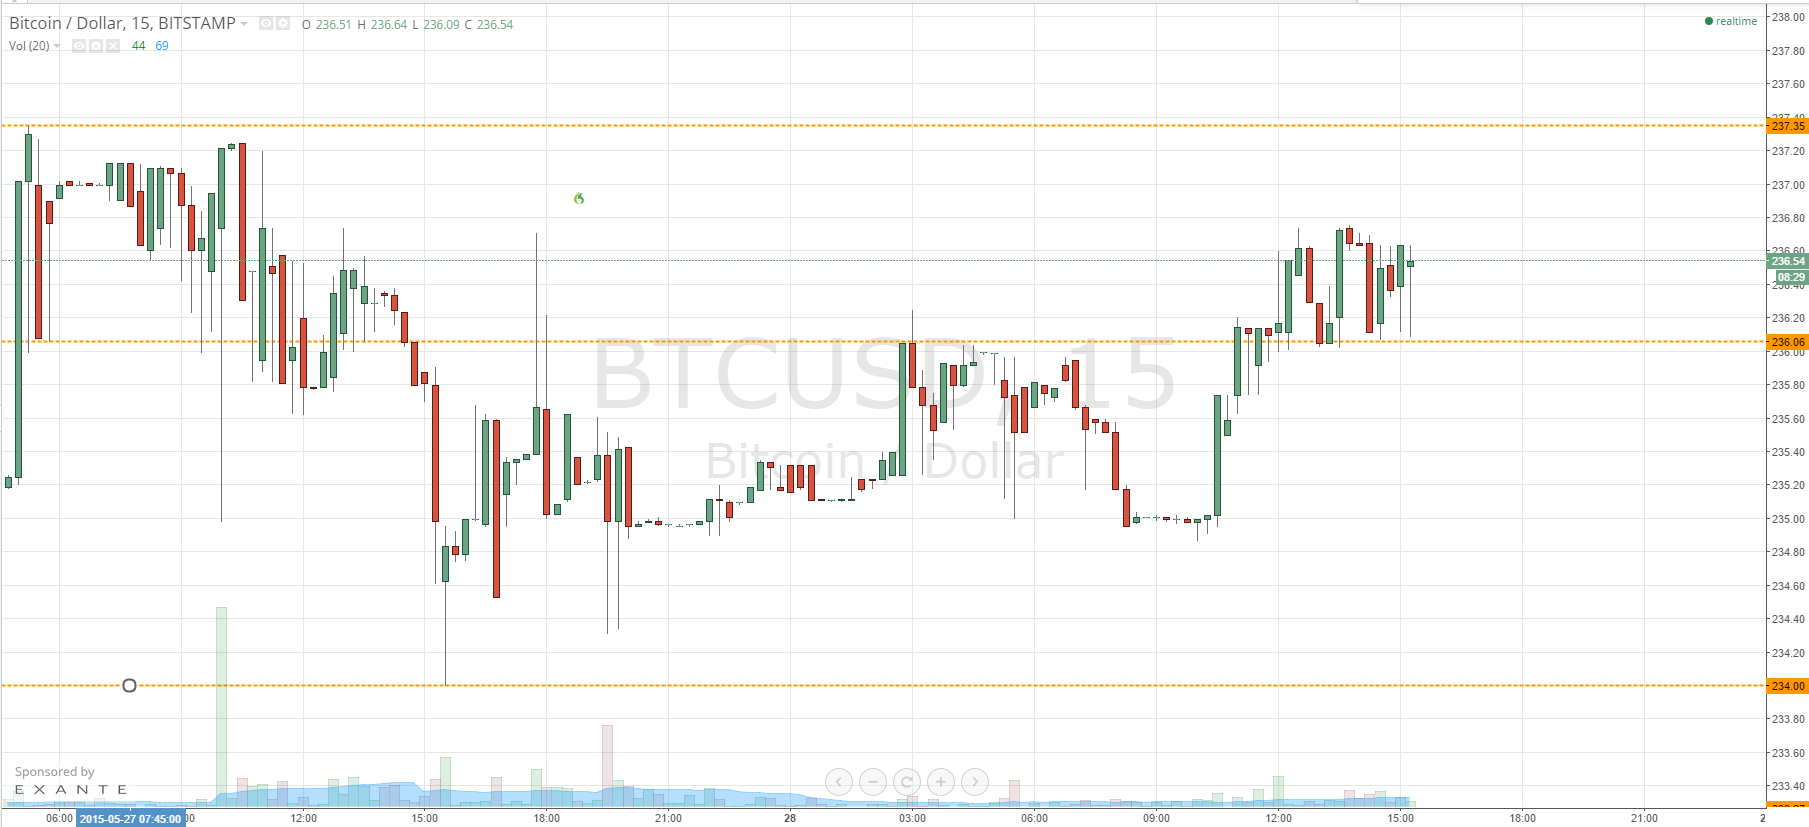
As you see from the chart, action today remained relatively flat until about 12 o’clock GMT – a point at which we saw the bitcoin price pop to the upside and break through the level that we had slated as in term resistance at 236.06. This put us long towards 237.35 as an initial upside target, but we have not yet reached that target and are still in our long position. Our stop loss is at 235.60, so if we can maintain the current bullish momentum we should be in for a nice profit. However, if we break back below what now serves as in term support, we may well be taken out of the trade for a small loss.
Since we are still in a trade, we wont be opening any more positions until the outcome of this one is confirmed. However, for readers not yet in the position, in term support now sits at 236.06 and resistance at 237.35. A break below support would validate 234 as an immediate downside target, with a stop loss somewhere around 236.76 ensuring you are taken out of the trade for just a small loss in the event of a reversal. Looking the other way, a run up towards 237.35 – and a break above this level on an intraday basis – would validate an entry towards 240 flat, with a stop loss at 236.6 maintaining a positive risk reward profile.
Charts Courtesy of Trading View