Shortly before European markets closed yesterday, we published our twice-daily bitcoin price watch piece, and highlighted the levels that we thought we would be watching during the Asian session last night. We also suggested that a classical technical charting pattern was forming in the bitcoin price – namely a head and shoulders pattern – and that this could hint at some bearish momentum and a reversal of the longer-term bullish trend we have seen over the past couple days. Action has now matured, and we have seen a validation of this pattern and the reaching of our downside intraday target. With this said, what are the levels that we are keeping an eye on today, and how can we get in and out of the market according to our breakout strategy? Take a look at the chart below.
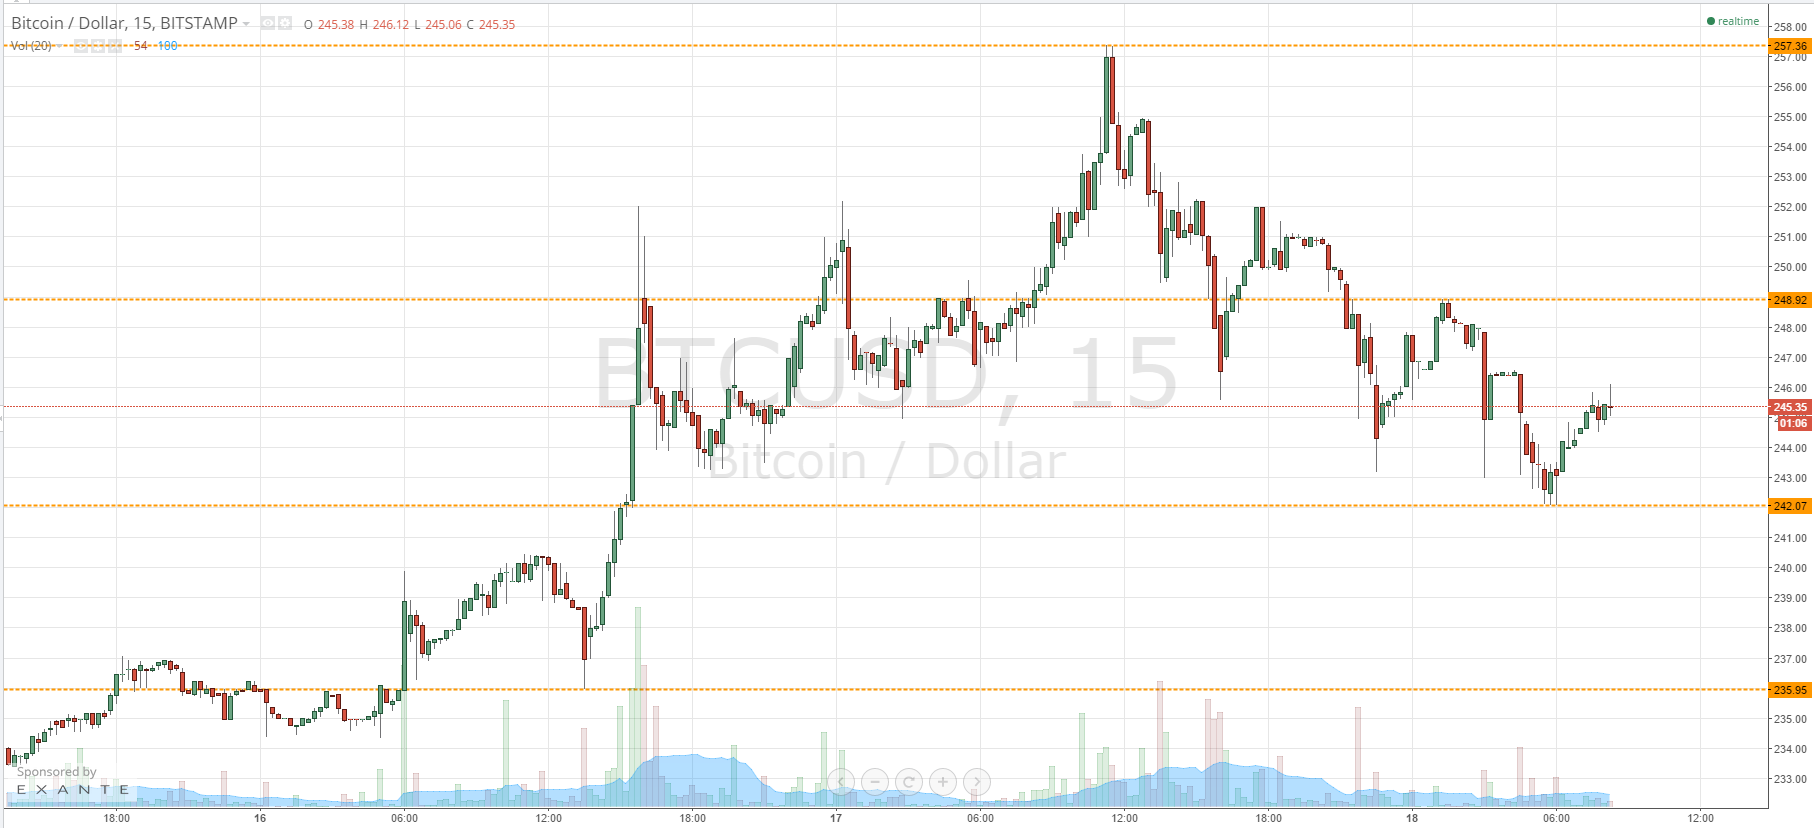
At the chart shows, we are currently trading around 245 flat – pretty much middle of the the range defined by the levels that were keeping an eye on today. These are 248.92 to the upside serving as in term resistance, and 242.07 to the downside serving as in term support.
We will initially look for a run down past 242.07 and a break below this level on an intraday basis to validate an initial downside target of 235.95. On this trade, a stop loss somewhere around current levels (245.35) will maintain a positive risk reward profile on the trade and ensure we are not taken out on the wrong side of a reversal.
Looking the other way, if we get a break above 248.92, it would validate yesterday’s highs at 257.36 as an immediate upside target, with a stop loss again somewhere around 245 maintaining a positive risk reward profile and taking us out of the trade in the event that we return to action within the range.
Charts courtesy of Trading View