

Late yesterday evening we published our twice-daily bitcoin price watch analysis piece. We pointed out that – despite plenty of volume – we have seen very little volatility in the value of bitcoin over the past week or so. This has posed a number of problems as far as our scalp strategy is concerned, but – as we also pointed out last night – it has given us an opportunity to employ our intra-range strategy – i.e. long at support and short at resistance. So, with this said, and now as we head into a fresh European session on Friday, what are the levels that we are keeping an eye on in the bitcoin price today, and how can we take advantage of any movement we get as we head into the weekend? Take a quick look at the chart below.
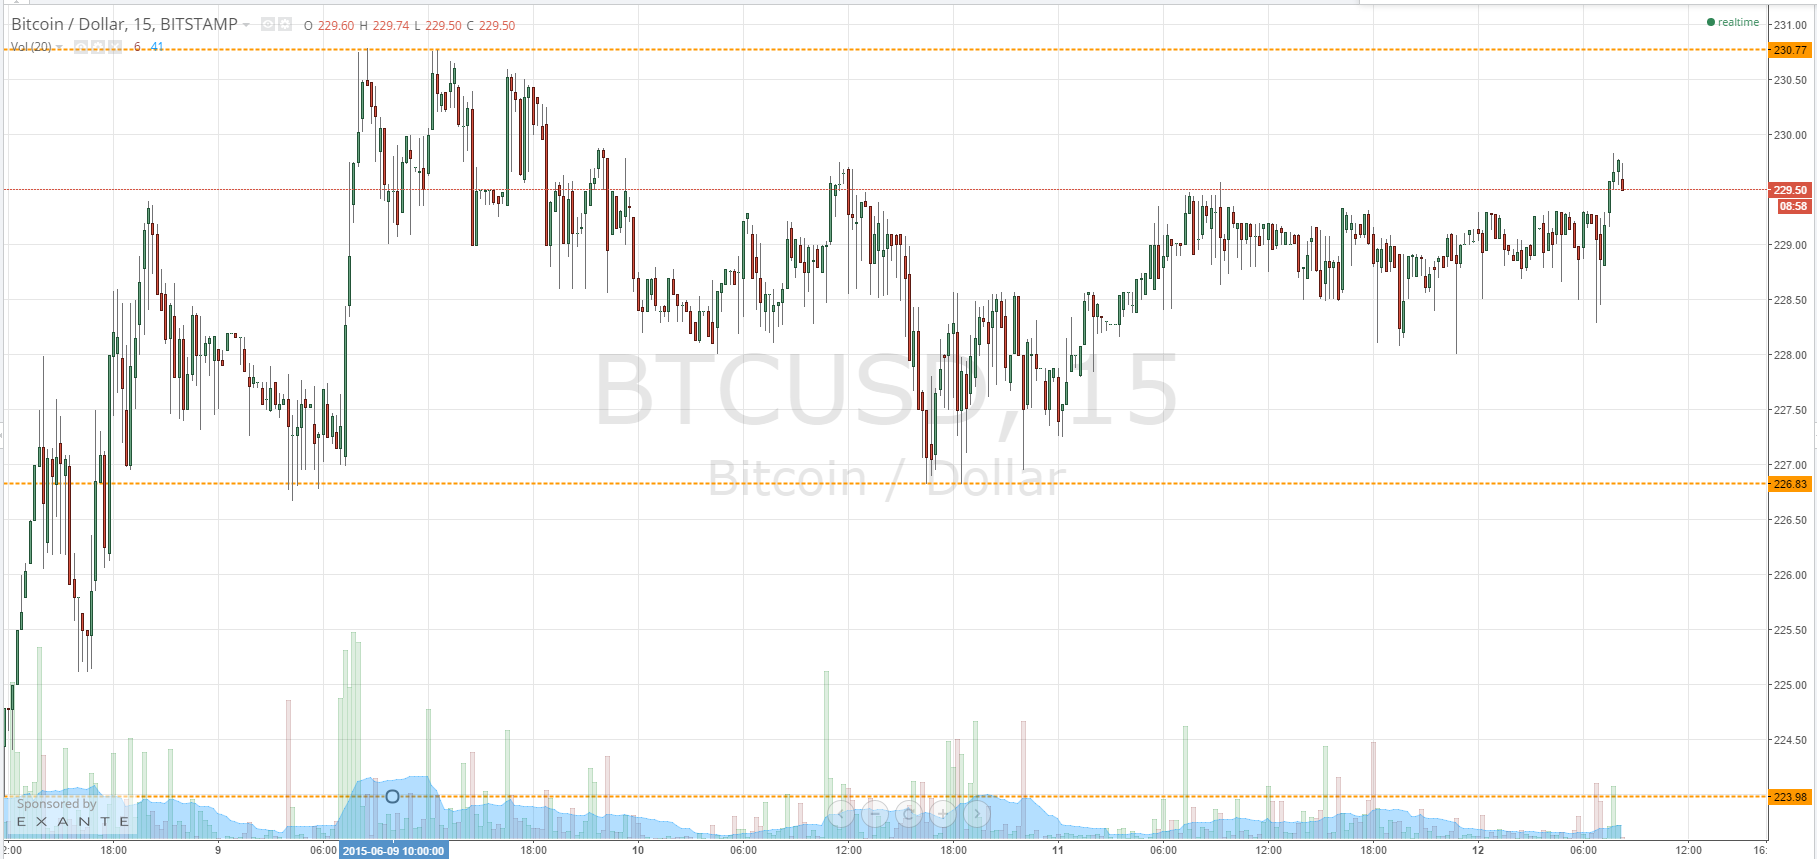
As the chart shows, we are currently trading mid-range between what serves as in term support at 226.83 and resistance at 230.77. These are the two levels that we are going to be keeping an eye on as we head into today’s session.
We are closer to resistance and support, and so we will initially look for a correction from 230.77 (i.e. a rejection and a return to bearish momentum) to validate a short entry towards 226.83, with a stop loss just above our entry, somewhere around 231.5. If we get a break above 230.77, we will enter long towards 234 with a stop loss around current levels.
Looking the other way, we will look to go long at support (i.e. a bounce from 226.83) towards 230.77 as an initial upside target, with a stop loss somewhere around 225.50 maintaining a positive risk reward profile. If we get a break below in term support, it will put us short towards 220 flat, with a stop loss around 228 making the trade worthwhile from a risk management perspective.
Charts courtesy of Trading View