

Once again, the bitcoin price has served up a considerable amount of volatility overnight. A little more unusually, it looks as though this volatility is filtering through to the European session, and translating to some upside momentum in the markets. As we head into this fresh European afternoon’s trading, what are the levels we are looking at in the bitcoin price, and where are we looking to get in and out of the markets according to our intraday strategy? Take a quick look at the chart below to get an idea of what we are watching.
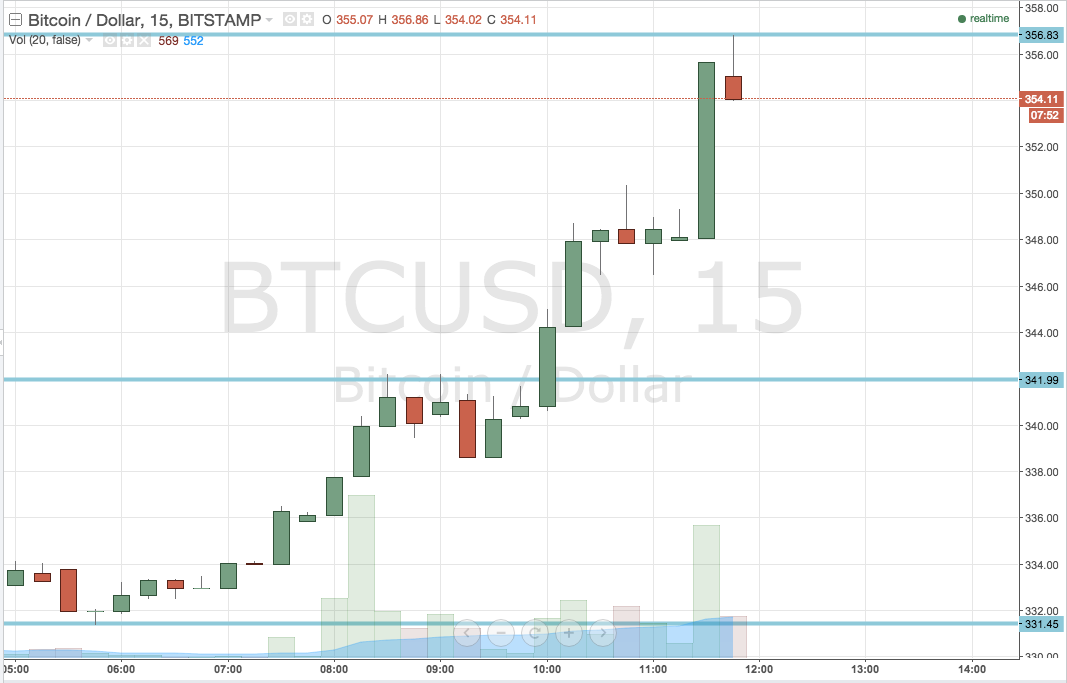

As the chart shows, the two levels we are keeping an eye on today – i.e. the two levels that define our range – are in term support at 341.99 and in term resistance at 356.83. This is a pretty wide range (comparative to our standard range width) so we can bring our intrarange strategy into play if action dictates an entry.
So, we will initially look for a break above resistance (and a close above this level) to put us long towards an upside target of 362 flat. A stop on this one somewhere in the region of 353 will keep things attractive from a risk management perspective.
Looking the other way, a close below in term support will validate a short entry towards 331.45. This is a slightly higher reward than the upside trade, giving us a little bit more wriggle room with our risk parameters. A stop at 346 looks like a nice placement.
As mentioned, with what amounts to about $15 worth of space between our range parameters, a long entry on a bounce from support and a short entry on a correction from resistance would also be nice medium term entries. On these ones, a stop loss just the other side of the entry levels will ensure we are taken out if the corrections reverse and we break out of the range.
Charts courtesy of Trading View