

The bitcoin price has been relatively stable over the last few days, but as per our standard trend, the action we have seen over the weekend looks to have injected some volatility into the space. The bitcoin price gained strength over the weekend, and hit overnight lows on Sunday night just shy of $400 flat – a level not seen in a little while.
So with this said, and as we head into a fresh week’s worth of action in the bitcoin market, what are the levels we are looking at today, and where are we looking to get in and out of the markets according to our intraday strategy? Take a quick look at the chart to get an idea of today’s parameters.
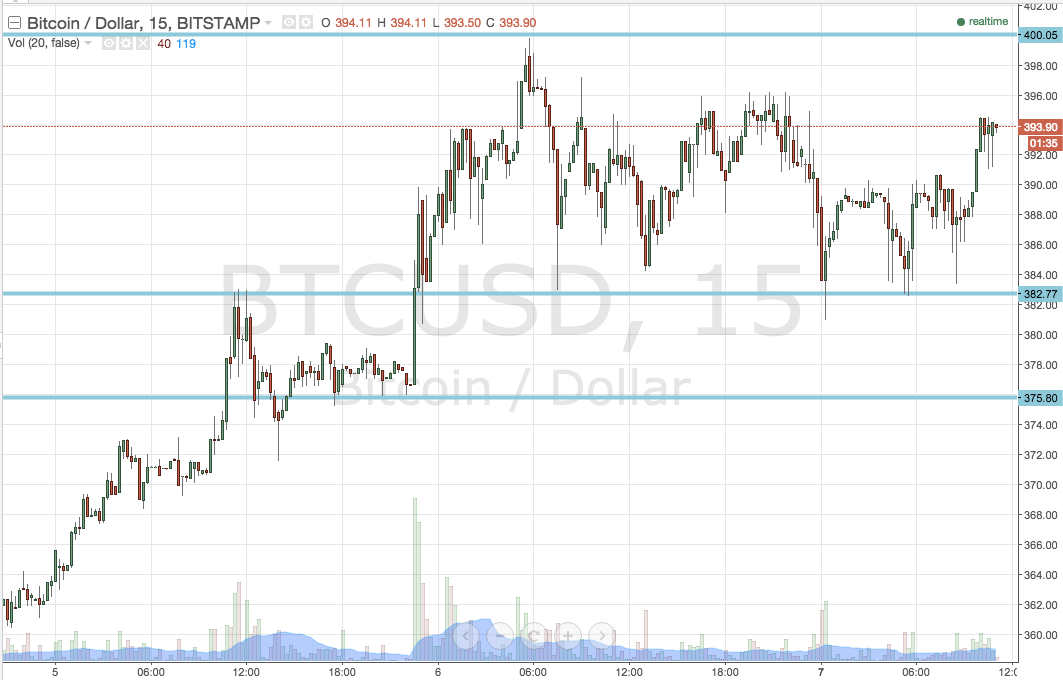

As the chart shows, the two levels that define today’s range are in term support at $382.77 and in term resistance at the aforementioned $400 flat. This range is relatively wide compared to some we have actioned in the past, and so we can bring both our intrarange strategy and our breakout strategy into play.
From a breakout perspective, we will look for a break of in term resistance (in line with the overarching bullish momentum) to put us long towards an initial upside target of $410 flat. With about ten dollars’ worth of reward on offer, a stop loss somewhere in the region of current levels ($395 flat) defines our risk nicely.
Looking the other way, a close below in term support will put us short towards an initial downside target of $375. This one is a little tighter than the upside trade, so a slightly tighter stop is required. $386 flat works well.
From an intrarange perspective, long at support and short at resistance, with a stop just the other side of our entry works well.
Charts courtesy of Trading View