In our intraday technical analysis piece we published yesterday afternoon, shortly before the European session drew to a close, we pointed out couple of key levels to watch in the bitcoin price and suggested that a break of any of these levels would offer us a medium-term bias and signal entry in the direction of the break. Action is now matured overnight, and we did see a break – somewhat unexpectedly – to the upside. This said, what are we looking at now in the bitcoin price? Take a quick look at the chart.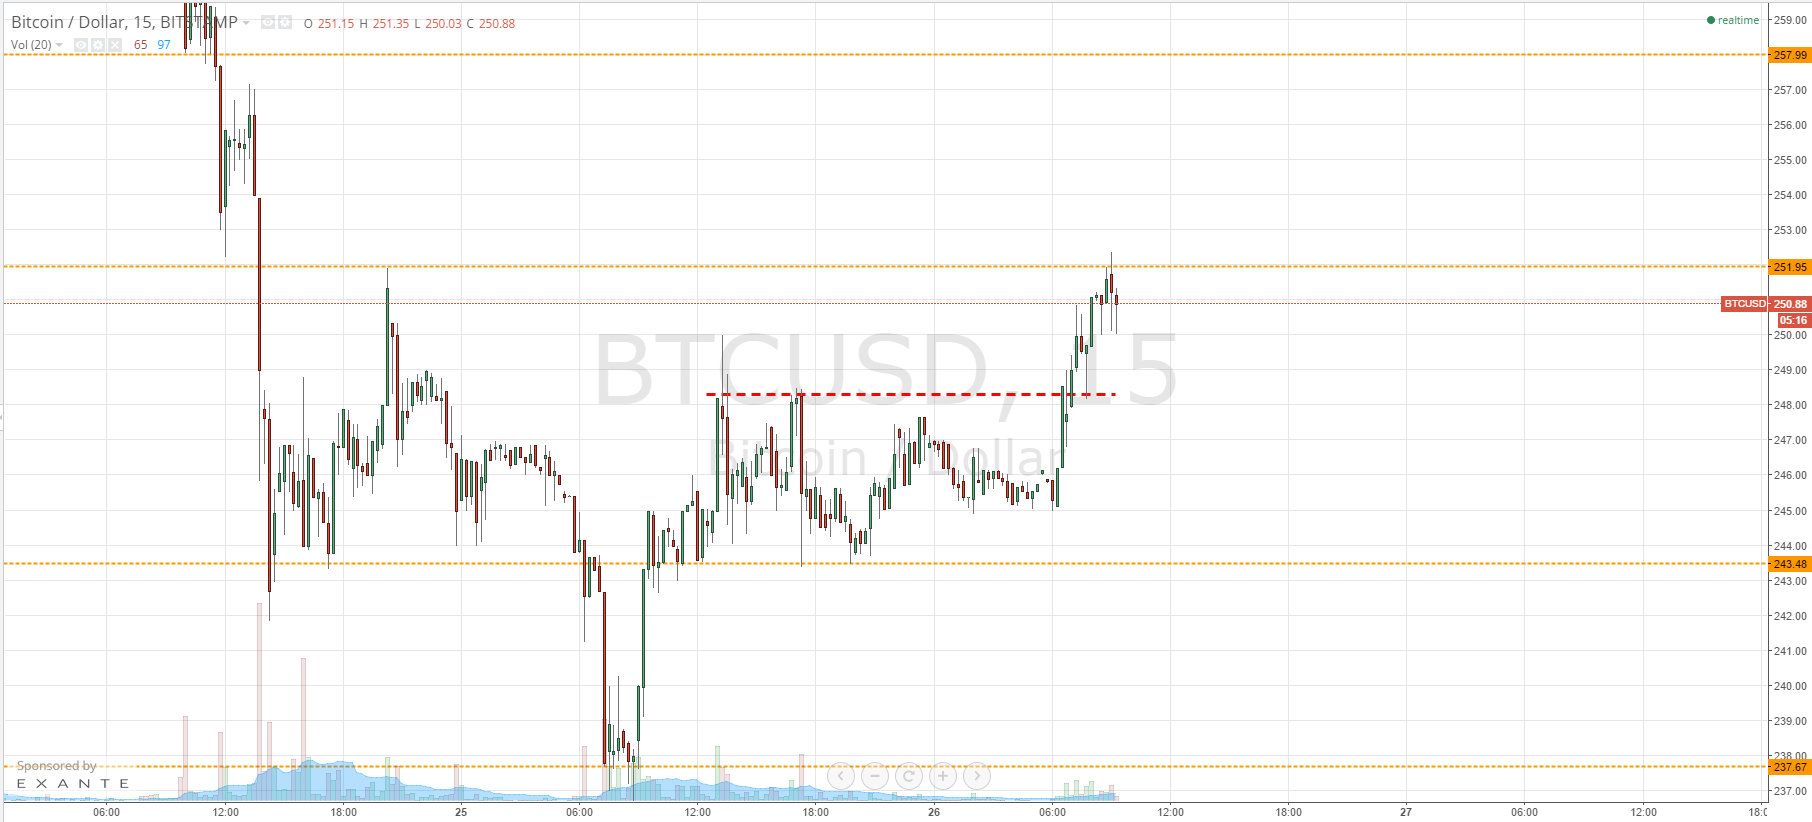
As the chart shows, having reached floors of around 237 early Tuesday morning, bitcoin recovered and corrected to trade in a range bound pattern throughout the majority of Wednesday. Early morning GMT on Thursday, we broke out of his range to the upside, with a resistance break at just ahead of 248 flat and – after a brief correction and retest of resistance as support – traded up to daily highs of 252 flat. The levels to keep an eye on now are 248.5 and aforementioned daily highs at 252. It is these levels that will give us our intraday bias.
If we can maintain the bullish momentum, and we see a break above 252, we will enter long towards an initial upside target of 258 flat. A stop loss just below 252 (somewhere around 250.8) will ensure we are taken out of the trade for a small loss in the event of a bias reversal.
Conversely, if we see the Bears take over and a run back down towards 248.5, we will look for a break below this level to mark a return to the bearish momentum and validate 243.48 as an intraday goal. Once again, a stop loss placed around 249 flat in the event of a short entry will take us out of the position if things go against us.
Charts courtesy of Trading View