

Action overnight on Wednesday was pretty mute, as relatively low volume translated to little or non-existent movement in the bitcoin price during the Asian session. We highlighted a couple of the key levels we were watching yesterday evening, and – while these levels have pretty much held – we didn’t get the breakout we were looking for in order to put us into a position. With this said, hopefully we will get some more decisive movements in the bitcoin price today. If we do, what are the levels we are looking for to put us long or short in the market, and where will we be looking to trade towards if we get in? Take a quick look at the chart.
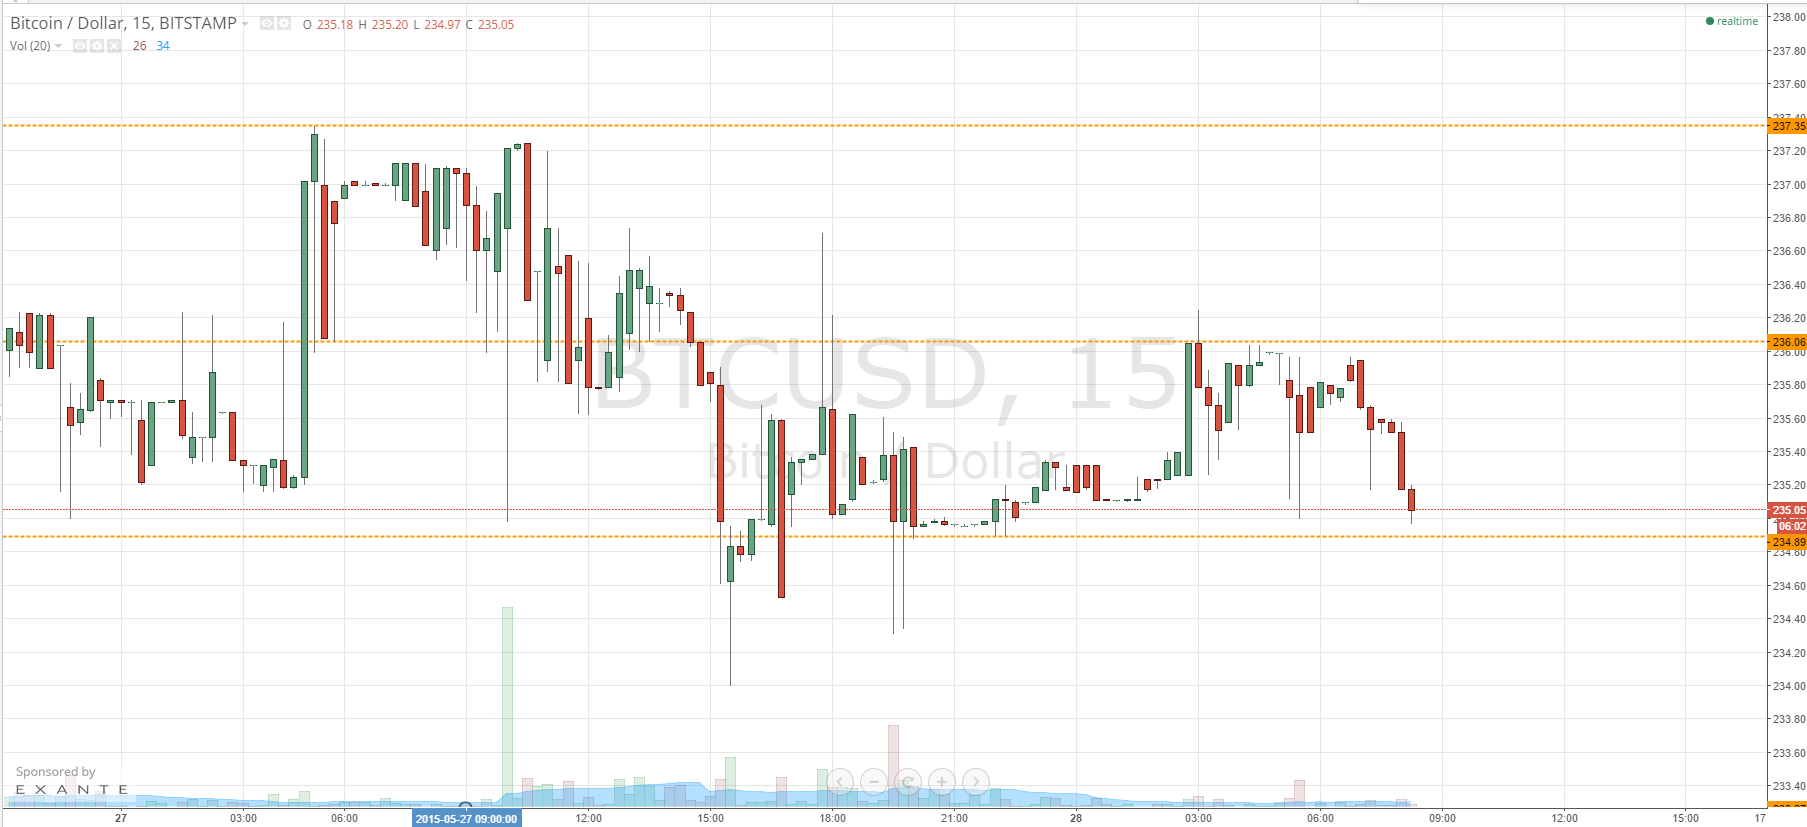
As you can see, we have narrowed today’s parameters quite considerably, and we are looking at 234.89 as in term support and 236.06 as in term resistance. We are currently hovering just ahead of aforementioned support, so we will address this first. If we can get a break below 234.89, and a close on the 15 minute candlestick chart, it will put us short towards an initial downside target of 233 flat. Not a huge amount of reward is available to us to the downside, so a tight stop is required – somewhere around 235.5 will be enough to take us out of the trade in the event the price reverses and turns back to trade within the range.
Looking the other way, if support holds at 234.89, we will look for a run up towards – and a break of – 236.06 to put us long towards a short-term upside target of 237.35. If we get beyond that, it would bring 240 into play. Once again, a tight stop is required on this trade, since somewhere around 235.40 looks fine as far as maintaining a positive risk reward profile is concerned.
Charts courtesy of Trading View