
In our twice-daily bitcoin price watch piece that we published early this morning, we highlighted the range through which bitcoin was trading following last night’s sharp decline, and suggested how we might respond to price reaching these levels as far as getting in and out of our strategy driven scalp trades was concerned. Now action has matured throughout the European session, and we are heading into the US afternoon, are the levels we were watching this morning still pertinent? Further, did we manage to get in to any trades on today’s action? Let’s take a look. Take a quick look at the chart.
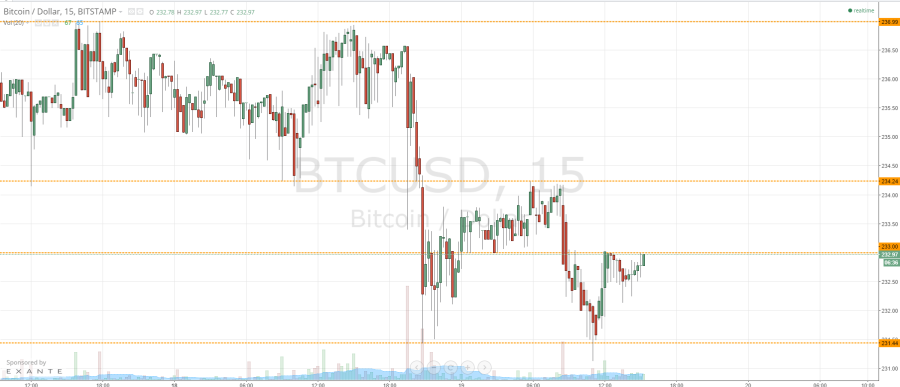

As the chart shows, shortly after we published our piece, we tested resistance which held firm at 234.24, and quickly broke through in-term support to trade down towards our target at 231.44. One thing worth mentioning is, the first time broke support, we quickly corrected to trade back within the range for a short period of time. This took out our stop loss on the initial entry, and we re-entered short on the second break (pretty much immediately following the first) and took out our target of 231.44 soon after.
The levels we are watching now are in term resistance at 233.00 and in term support at our previous downside target of 231.44. We are just trading short of resistance the moment (somewhere just shy of 232.97 at time of writing), and if we get a break above it, we will enter long towards 234.24, with a stop loss somewhere around 232.5. If, however, current levels hold as resistance, we will look to enter on a correction towards – once again – 231.4. On this trade, a stop loss somewhere around 233.75 should be loose enough to avoid us being chopped out again, while still giving us a positive risk to reward profile on the trade.
Charts courtesy of Trading View