Bitcoin Price Key Highlights
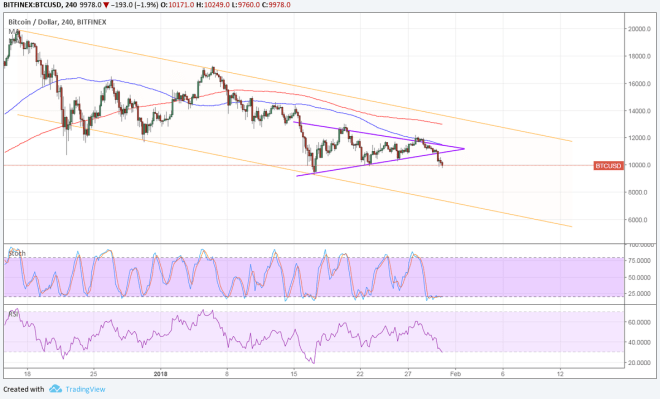
- Bitcoin price broke below its short-term triangle consolidation pattern, setting its sights on the channel support at $6,000.
- The chart pattern spans $9,000 to $13,000 so the resulting breakdown could be of the same height.
- Technical indicators are giving mixed signals, so it’s tough to tell what’s next for bitcoin price from here.
Bitcoin price seems ready for another wave lower as price broke below a short-term consolidation pattern.
Technical Indicators Signals
The 100 SMA is below the longer-term 200 SMA so the path of least resistance is to the downside. In other words, the selloff is more likely to resume than to reverse. Also the gap between the moving averages is widening to reflect stronger bearish momentum.
RSI is still heading south, which means that bitcoin price could follow suit. However, the oscillator is nearing oversold levels to reflect exhaustion among sellers. Stochastic is already reflecting oversold conditions and looks ready to turn higher, possibly drawing buyers back to the mix.
In that case, a quick pullback to the broken triangle support could ensue or stronger bullish pressure could lead to a pullback to the channel resistance near the 200 SMA and $12,000 area of interest.

Market Factors
Profit-taking was evident in the financial markets as the end of the month came just before the State of the Union address and the FOMC decision, which could have strong impact on US assets and the dollar.
For bitcoin price, this meant another leg down as more investors were convinced to liquidate their holdings in the absence of any positive catalysts. So far, bitcoin has been weighed down by crackdowns in South Korea, an exchange hack and shutdown in Japan, and the emergence of rival altcoins.
Although there have been a few good developments here and there, bitcoin price appears more sensitive to negative updates likely on recency bias. For instance, news that Facebook is banning cryptocurrency ads took its toll on prices earlier this week.