Bitcoin Price Key Highlights
- Bitcoin price was off to a good start for the year, as three long green candles are forming on the weekly time frame.
- This reflects strong bullish pressure onto the first trading week of January, perhaps an omen of how price action could turn out for the rest of the month.
- Price has taken out the long-term resistance at the $1000 mark and is setting its sights on the next ceiling at $1100.
Bitcoin price seems unstoppable in its climb as it kicked off 2017 on a strong bullish note with these candlestick formations.
Technical Signals
The 100 SMA is still above the longer-term 200 SMA on this time frame, signaling that the long-term path of least resistance is to the upside. Also, the gap between the moving averages seems to be widening again to indicate a pickup in bullish pressure.
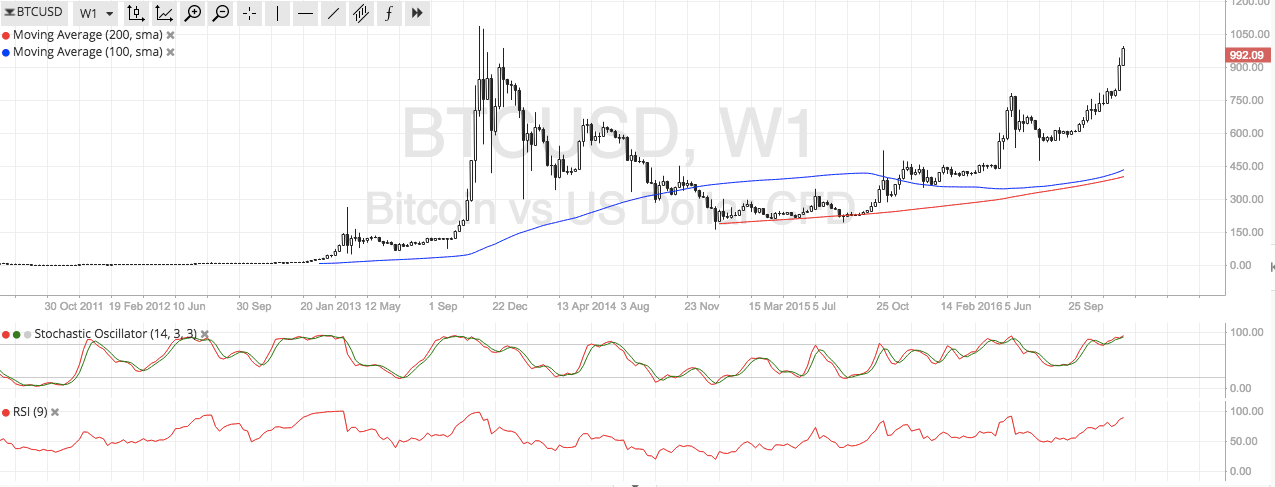

Stochastic is still hovering around the overbought region, though, so bulls might need to take a break sooner or later. If sellers take this opportunity to ramp up their bearish activity, a brief pullback could be seen on short-term charts. RSI is still on the move up, which means that there’s still enough room to go higher. The next long-term resistance is located close to the $1100 major psychological level at which some buyers could book profits.
Market Events
Most of bitcoin price gains recently can be attributed to reports from China, indicating that foreign investment continued to pick up towards the end of 2016 even as the government moved to curb this activity. Investors have been looking for higher returns elsewhere while monetary authorities attempted to devalue the local currency.
To top it off, a bit of anti-dollar sentiment has allowed bitcoin price to sustain its climb. Investors are starting to feel the jitters for the Trump administration. Breaking past the $1100-1200 highs could open the door for further upside in the cryptocurrency for the rest of the month or even throughout the quarter, as geopolitical uncertainties are dampening investor sentiment so far.
Charts from SimpleFX