Bitcoin Price Key Highlights
- Bitcoin price seems unstoppable in its climb, as the long-term charts feature a bullish candlestick formation.
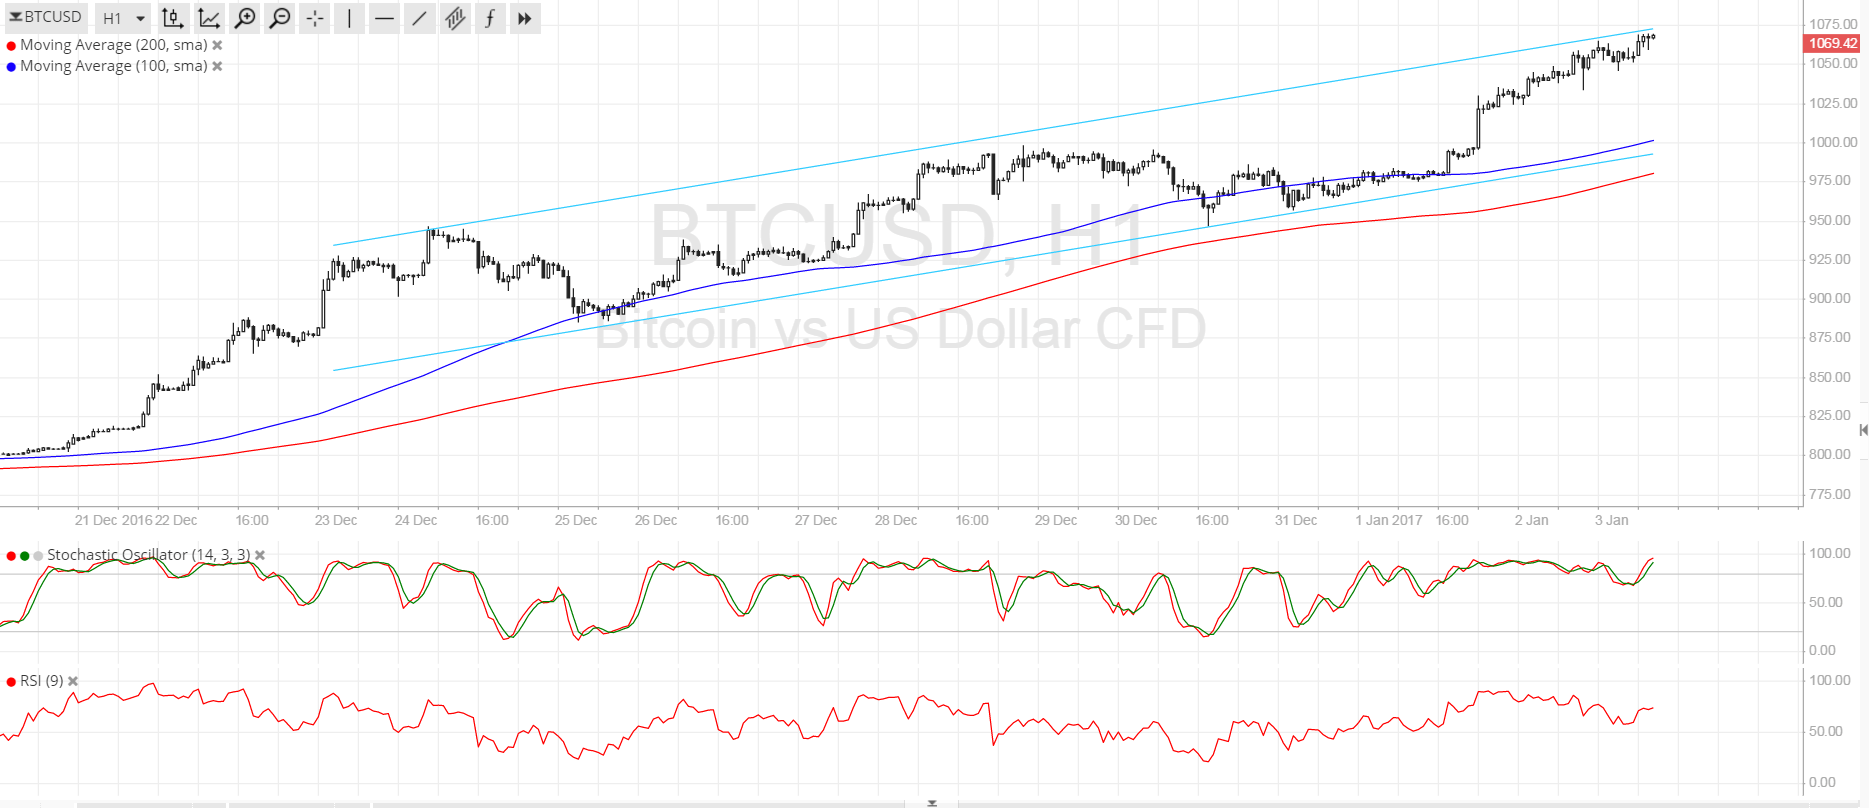
- At the moment, price is moving inside an ascending channel on its 1-hour chart and is currently testing resistance.
- If this holds as a ceiling, traders could see the much-awaited pullback that could draw more bulls to the mix.
Bitcoin price continues to trend higher but the ascending channel on the 1-hour chart offers pullback opportunities.
Technical Indicators Signals
The 100 SMA is above the longer-term 200 SMA on this time frame so the path of least resistance for bitcoin price is to the upside. The short-term moving average coincides with the bottom of the channel at the $1000 psychological level, adding to its strength as a near-term floor in the event of a correction. The 200 SMA is close by so a spike lower could still bounce off this region.
Stochastic is still hovering around the overbought levels, which suggests that buying pressure could fade as bulls might want to book profits off their recent long positions. RSI is starting to turn lower to reflect a return in selling momentum, offering a chance for a quick countertrend play at the channel resistance around $1075-1100.

Market Events
Most global exchanges are set to reopen today, opening the door for more bitcoin price moves in either direction. So far, fundamentals are supportive of more gains as investors appear to be positioning for the macro themes expected to come into play for the year, including euro zone elections, Brexit, and Trump’s administration.
Keep in mind, however, that Caixin just reported a surprise gain in China’s manufacturing PMI from 50.9 to 51.9 to indicate a stronger pace of industry expansion. This could draw investors back to mainland assets instead of hunting for higher returns in offshore investments and away from the yuan. Still, recent reports highlighting the outflow of funds from China could further encourage traders to ditch local market holdings in favor of better yields.
Charts from SimpleFX