Bitcoin Price Key Highlights
- Bitcoin price is still trading inside the ascending channel illustrated in an earlier article, signaling that bullish momentum is in play.
- Traders have been waiting for a decent pullback to reestablish long positions but it seems that the correction was pretty shallow.
- Price found support at $1050 before making another attempt to break past the channel resistance.
Bitcoin price has its sights set much higher and is making another push past the ascending channel resistance for a sharper climb.
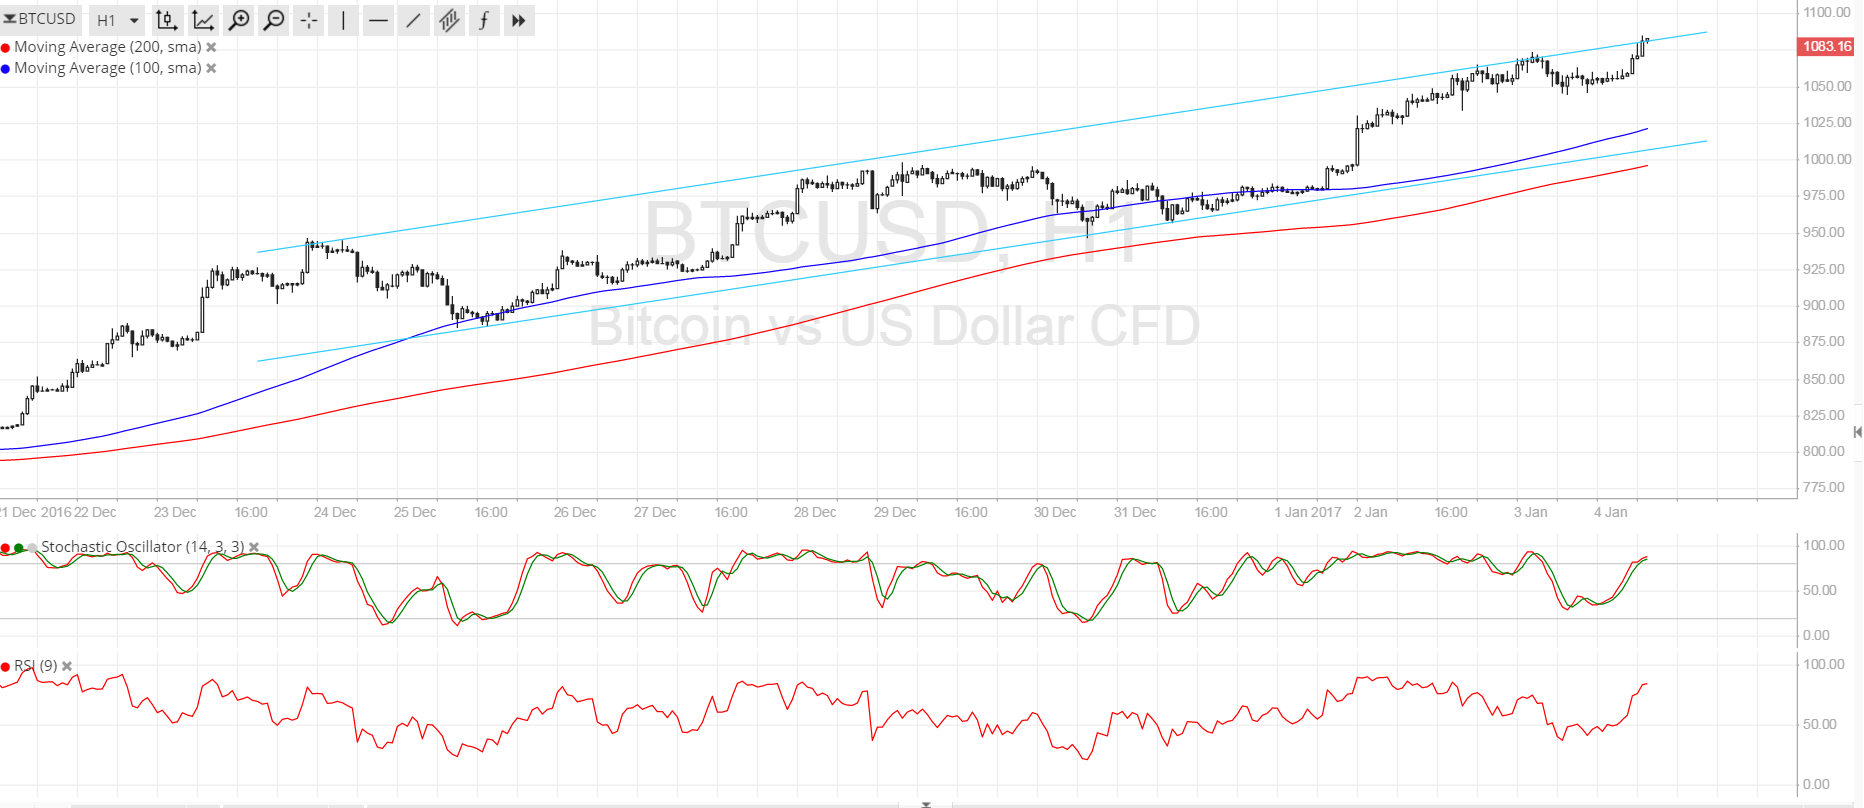
Technical Indicators Signals
The 100 SMA is still on the 200 SMA on the 1-hour time frame so the path of least resistance is to the upside. The short-term moving average coincides with the channel support at $1000 while the 200 SMA is just slightly below it, acting as the line in the sand in the event of a larger pullback.
Stochastic is on the move up once more, even without hitting the oversold area, which means that buyers are regaining control of bitcoin price action. If bullish pressure is strong enough, traders could push for a break towards the $1100 level, just slightly above the channel resistance.
RSI is also heading north so bitcoin price could follow suit. However, the oscillator is nearing the overbought zone and turning lower could draw some sellers to the mix or convince buyers to book profits for the time being, possibly leading to another dip.

Market Events
There are a couple of top-tier catalysts for the US dollar this week, and these are the release of the FOMC meeting minutes and the NFP report. The minutes should give more clues on the timing of the next Fed rate hikes, although a bit of disappointment in terms of hawkishness could lead to dollar weakness.
Still, the main driving force for bitcoin price these days appears to be the bleak outlook for emerging markets, particularly China. Although the Caixin PMI revealed a stronger pace of manufacturing industry expansion, traders seem to be positioning for more capital outflows from the country and are also on the hunt for higher returns in alternative assets like bitcoin.
Charts from SimpleFX