Bitcoin Price Key Highlights
- Bitcoin price has been under a lot of downside pressure lately, thanks to warnings from the Chinese government on bitcoin exchanges and traders.
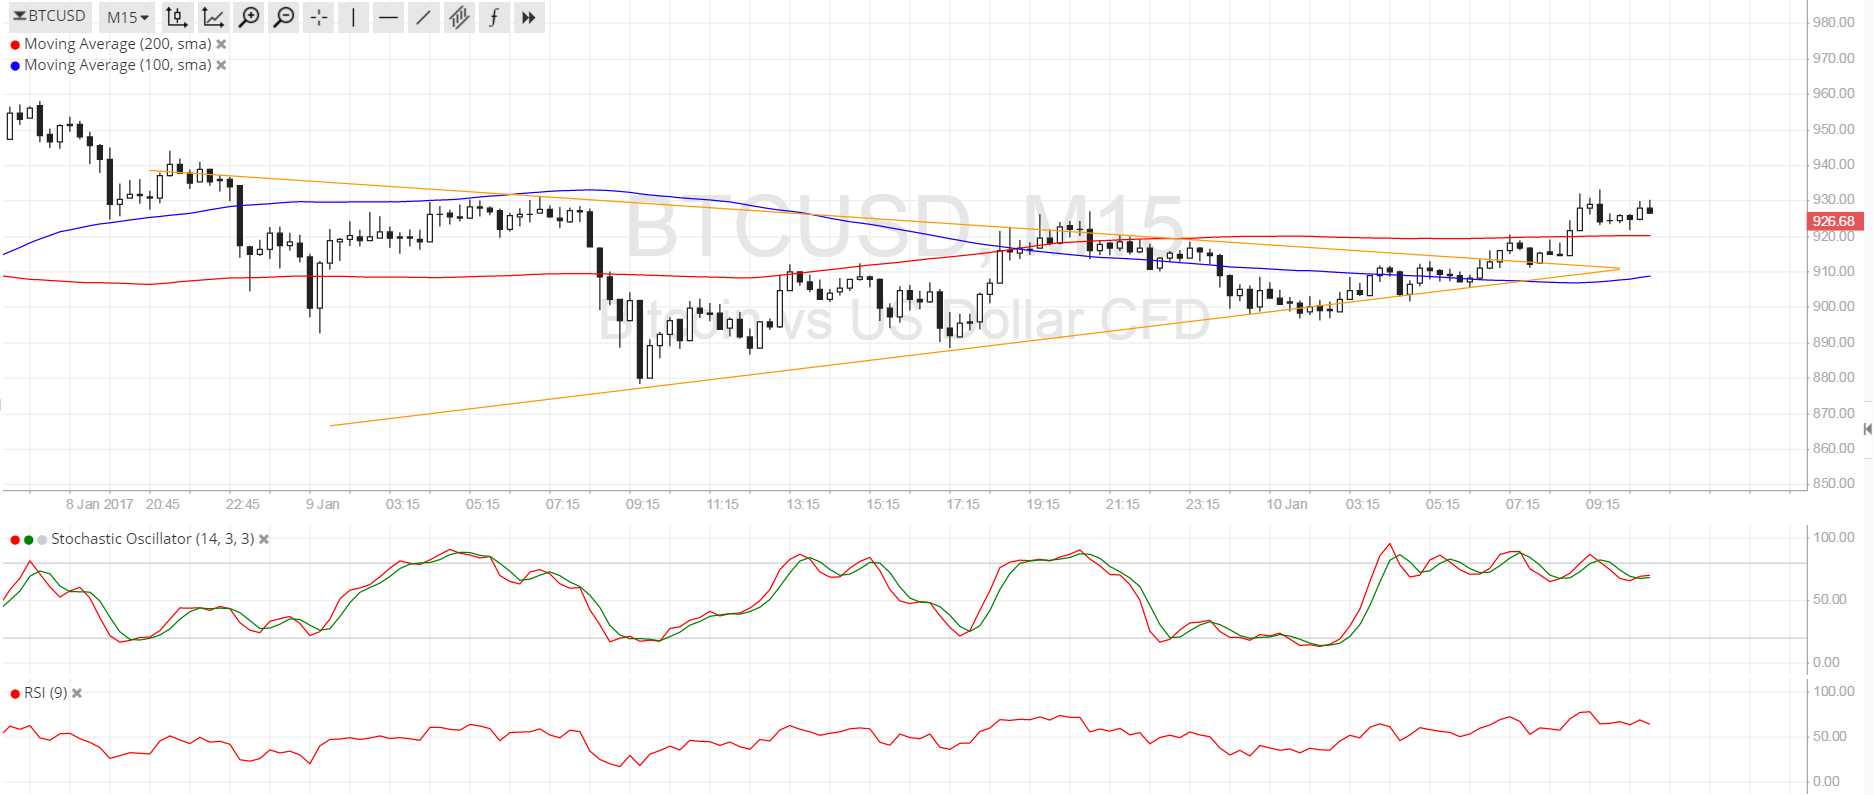
- Price has consolidated after its sharp drop at the beginning of the month as investors are now waiting for more clues.
- Bitcoin formed a small symmetrical triangle visible on short-term time frames and has broken to the upside.
Bitcoin price has been trading sideways recently but made an upside break from a short-term triangle pattern, signaling that buyers are putting up a fight.
Technical Indicators Signals
The 100 SMA is still below the longer-term 200 SMA on this time frame so there may be some selling pressure left. Stochastic is also hovering at the overbought zone and hasn’t turned lower so buyers might need to take a break and let sellers take over. Meanwhile, RSI is treading sideways and barely offering any strong directional clues.
Still, the breakout from the triangle consolidation pattern could be indicative of a return in bullish momentum, likely taking bitcoin price up to the next area of interest at $940-950. Stronger buying pressure could lead to a climb back to the $1000 psychological mark.
On the other hand, if another wave of selling takes place, price could revisit support at $880 or head lower, depending on how market catalysts turn out.

Market Events
Earlier in the week, investors have turned their attention to China’s warnings against bitcoin trading, with monetary authorities reiterating the need for KYC and AML checks for cryptocurrency trades. This comes after the central bank intervened in the forex market to halt the yuan slide, hurting bearish speculators.
At the moment, traders are wary of similar moves in the bitcoin market, although experts have repeatedly emphasized that this would be nearly impossible to implement. Once these concerns fade, bitcoin price could regain ground as traders try to catch the longer-term rallies at cheaper levels.
Charts from SimpleFX