

Bitcoin Price Key Highlights
- Bitcoin price is still on a short-term uptrend, as illustrated by the ascending channel formation in a previous article.
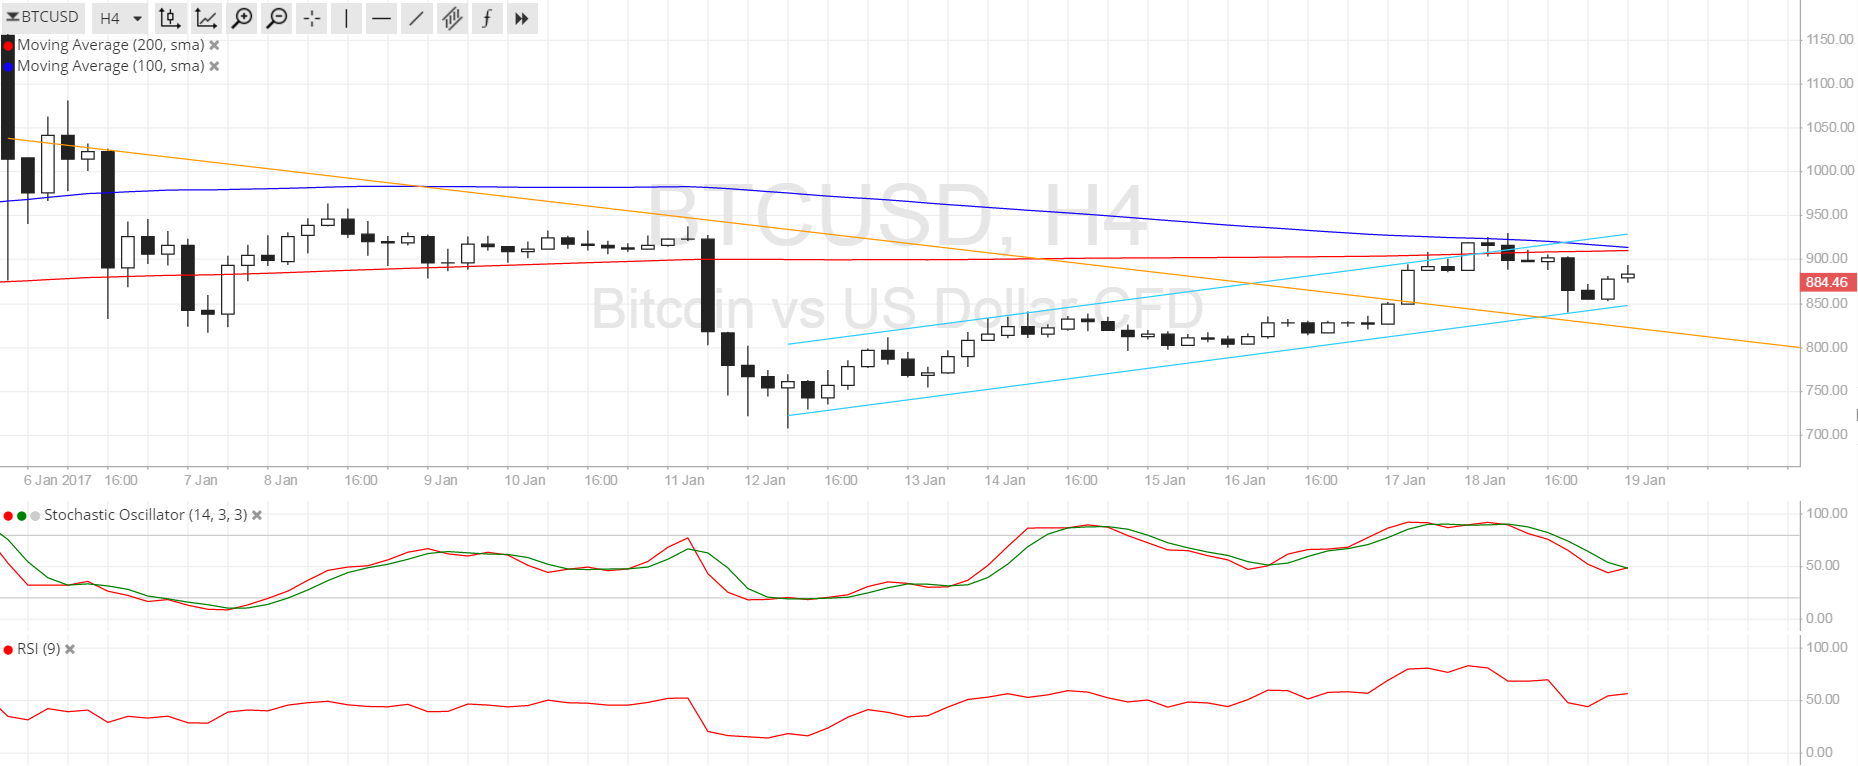
- Price is now testing the channel support, which lines up with a longer-term broken trend line.
- Bullish pressure seems to be returning at this point, possibly sending bitcoin price back up to the near-term highs and beyond.
Bitcoin price has just bounced off a confluence of support levels, but technical indicators are giving mixed signals for now.
Technical Indicators Signals
The 100 SMA seems ready to cross below the longer-term 200 SMA on the 4-hour time frame to suggest that the path of least resistance is to the downside. This could push bitcoin price back below the descending trend line resistance connecting the highs since the start of the year. The moving averages appear to have held as dynamic resistance as well.
Stochastic is heading south to show that sellers are taking control of bitcoin price action. If so, it could head back to the next near-term area of interest at $800 or lower. On the other hand, if bullish momentum is sustained, bitcoin could break past the latest highs at $925 and push for a rally up to the $1000 major psychological level and beyond.

Market Events
There is a lot of market anxiety leading up to US President-elect Trump’s inauguration tomorrow, which explains the lack of volatility in the dollar and bitcoin. Traders seem hesitant to put in large positions ahead of this major catalyst, as price could swing back and forth before establishing a clearer direction. Besides, profit-taking ahead of the actual event might be observed.
Investors are also particularly cautious with their bitcoin trades since the crackdown on exchanges and clients in China is still going on. Traders are waiting to see if the government will impose any restrictions that could curb bitcoin activity in the country, thereby putting more downside pressure on price. It may take a while before bulls step on the gas once they feel confident that bitcoin trading in China won’t be curtailed.
Charts from SimpleFX