Bitcoin Price Key Highlights
- Bitcoin price has formed lower highs on its 1-hour time frame and found support around $900.
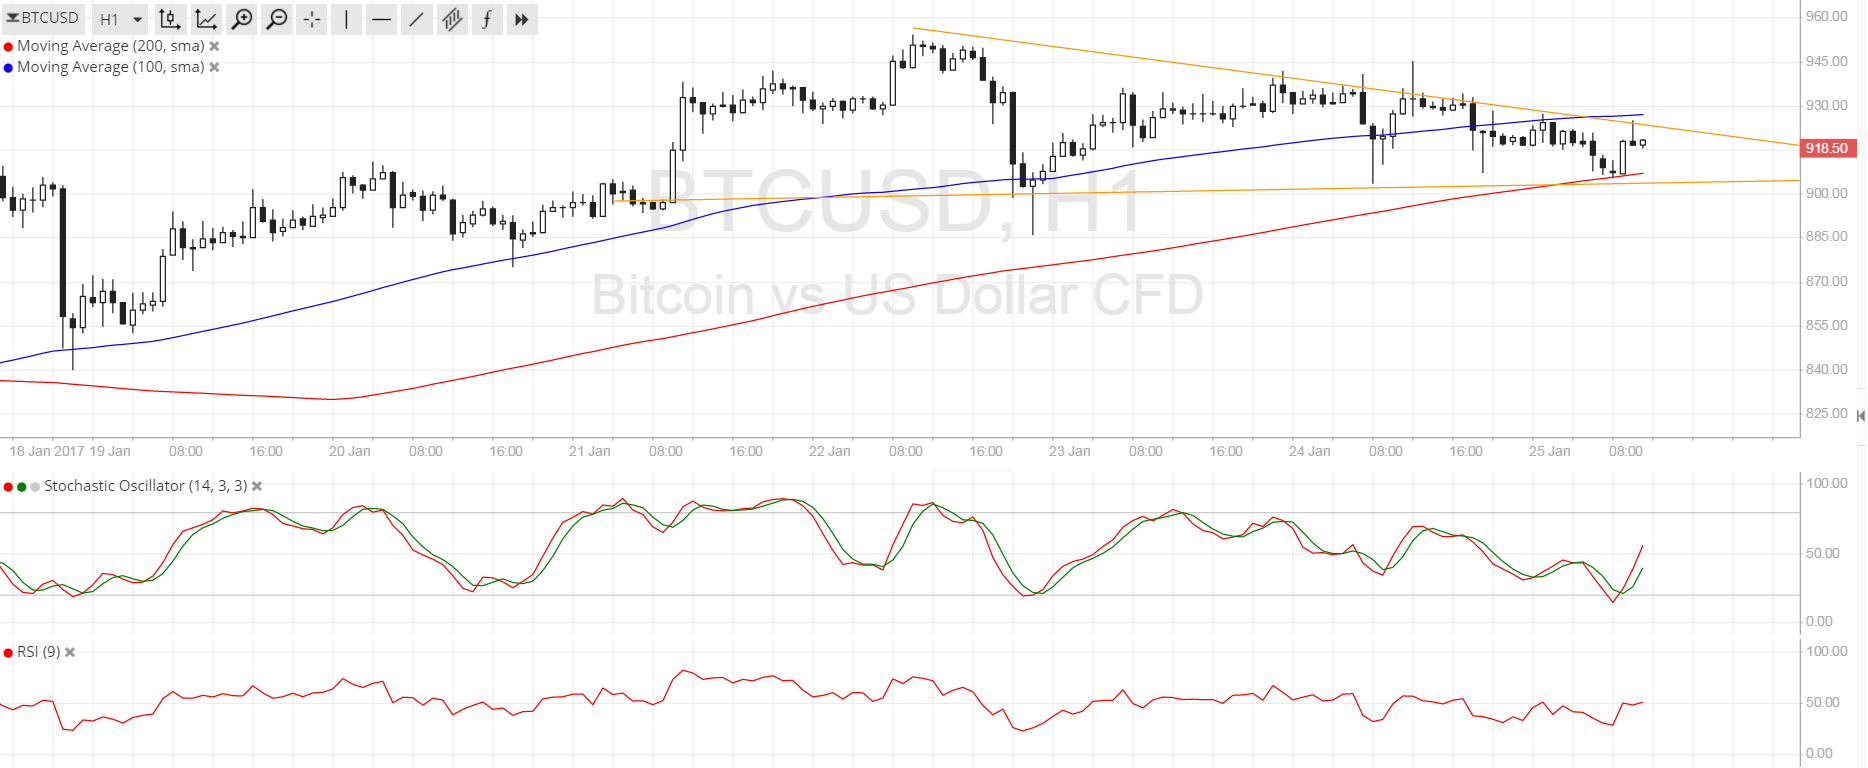
- This has led to the creation of a small descending triangle consolidation pattern on the short-term chart.
- The direction in which price breaks out could set the longer-term trend for bitcoin.
Bitcoin price is currently settling inside a descending triangle pattern and could be due for a breakout soon.
Technical Indicators Signals
The 100 SMA is above the longer-term 200 SMA so the path of least resistance is to the upside. This suggests that a break higher could be more likely to take place than a move lower. In that case, bitcoin price could move up to the $955-960 area next. Also, the 200 SMA is holding as dynamic support since it lines up with the triangle bottom.
Stochastic is turning higher to suggest that bulls are trying to take control of bitcoin price action, also supporting the idea of an upside break. RSI is moving sideways, barely offering any strong clues on direction, so the consolidation could carry on. A downside break could take bitcoin price to the lows at $850 or lower.

Market Events
Investors are still feeling the jitters from the Trump presidency but the dollar seems to be putting up a good fight against its counterparts now that the first couple of days went by without much of a glitch. Trump’s first few executive orders are consistent with his “America First” theme so this could usher in stronger growth for the economy and keep the Fed on track towards hiking interest rates three times this year.
Over in China, demand for bitcoin remains limited as exchanges announced fees on cryptocurrency trading. The Chinese central bank has conducted inspections of bitcoin exchanges and reported violations, prompting the firms to introduce restrictions in order to stay in business. However, liquidity was noticeably lower after the announcements as traders became increasingly anxious while others decided to cash in on their positions.
Charts from SimpleFX