Bitcoin Price Key Highlights
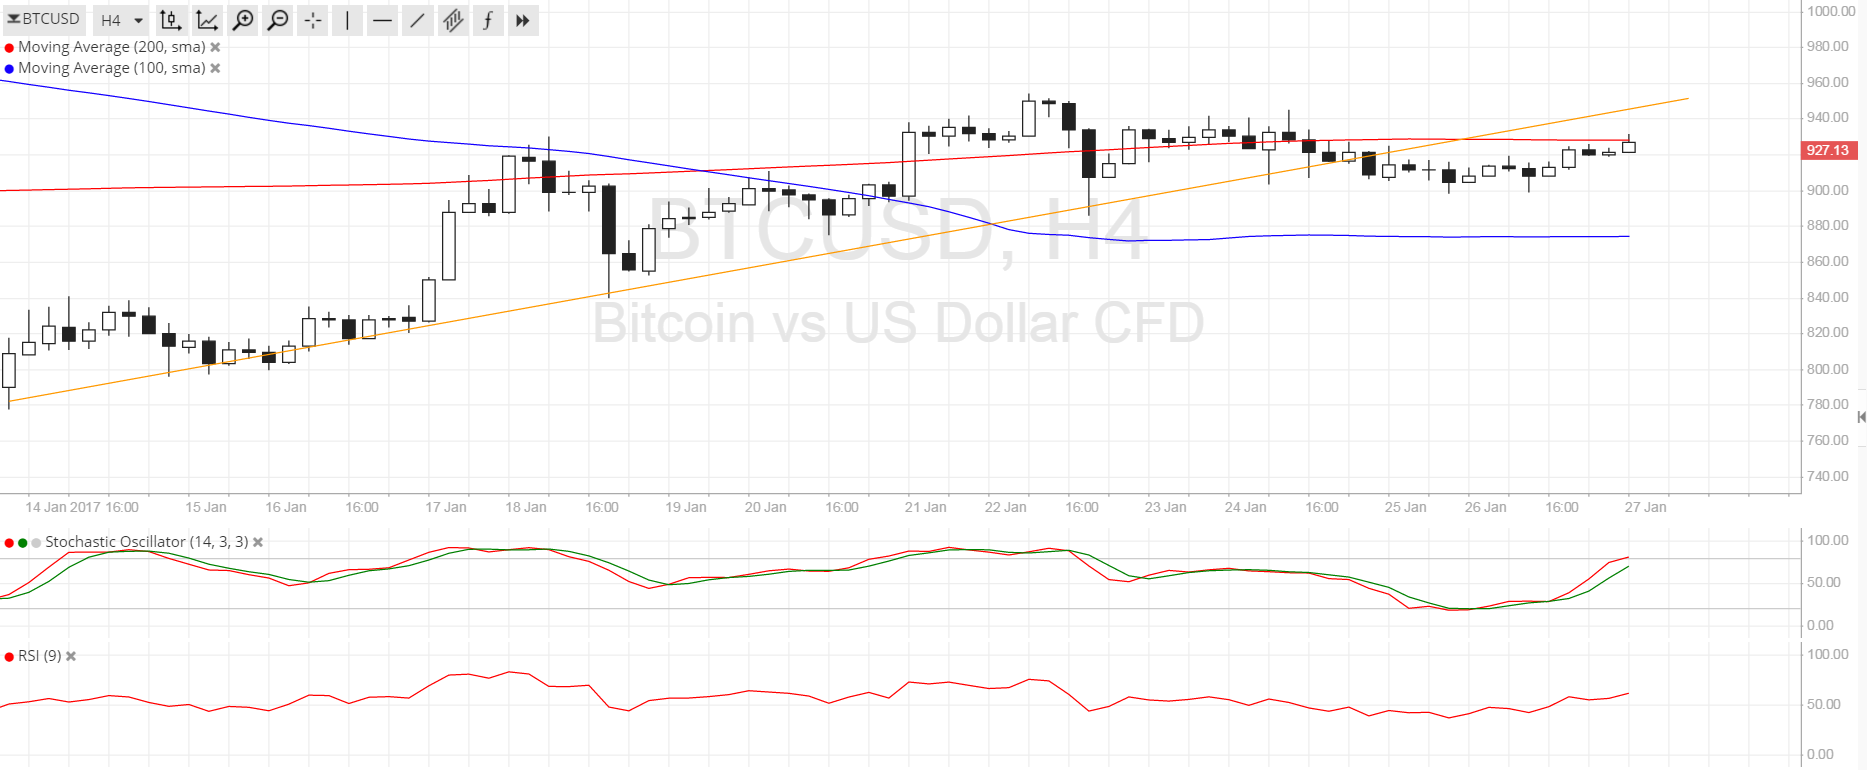
- Bitcoin price is pulling up from its recent selloff after breaking below a rising trend line visible on the 4-hour chart.
- Price could be due for a retest of the broken support area before resuming its drop, possibly creating a head and shoulders pattern.
- A break below this formation’s neckline around $880-900 could serve as a stronger signal for a downtrend.
Bitcoin price has been pulling up recently but is still under heavy selling pressure, especially once this correction is completed.
Technical Indicators Signals
The 100 SMA is safely below the longer-term 200 SMA on the 4-hour time frame so the path of least resistance is to the downside. Also, the 200 SMA appears to be holding as dynamic resistance for the time being, as it lines up with the broken trend line support.
Stochastic is still heading up to show that there’s still some buying pressure left. Similarly, RSI is moving higher and is making its way to the overbought area. Once the oscillators indicate overdone conditions, sellers could regain control of bitcoin price action and push for a drop until the 100 SMA dynamic support. Further declines below this area could take it down to $800 next then to $750.

Market Events
Market anxiety is still pretty evident, although it’s worth noting that US equities continue to advance on the Trump administration’s protectionist plans. Still, this has dampened demand for the dollar and kept other safe-haven assets supported since there is still a considerable amount of uncertainty. Fears of a trade war are in play and further conflict could drive up bitcoin price.
However, the ongoing investigations on bitcoin exchanges and clients in China continues to limit bitcoin price gains. After all, regulators seem to be successful into forcing firms to implement restrictions, whether it’s through charging higher transactions costs or ceasing to offer bitcoin margin accounts, in order to curb trading and speculative activity in the mainland.
Charts from SimpleFX