Bitcoin Price Key Highlights
- Bitcoin price continues to tread sideways, consolidating in a symmetrical triangle visible on short-term charts.
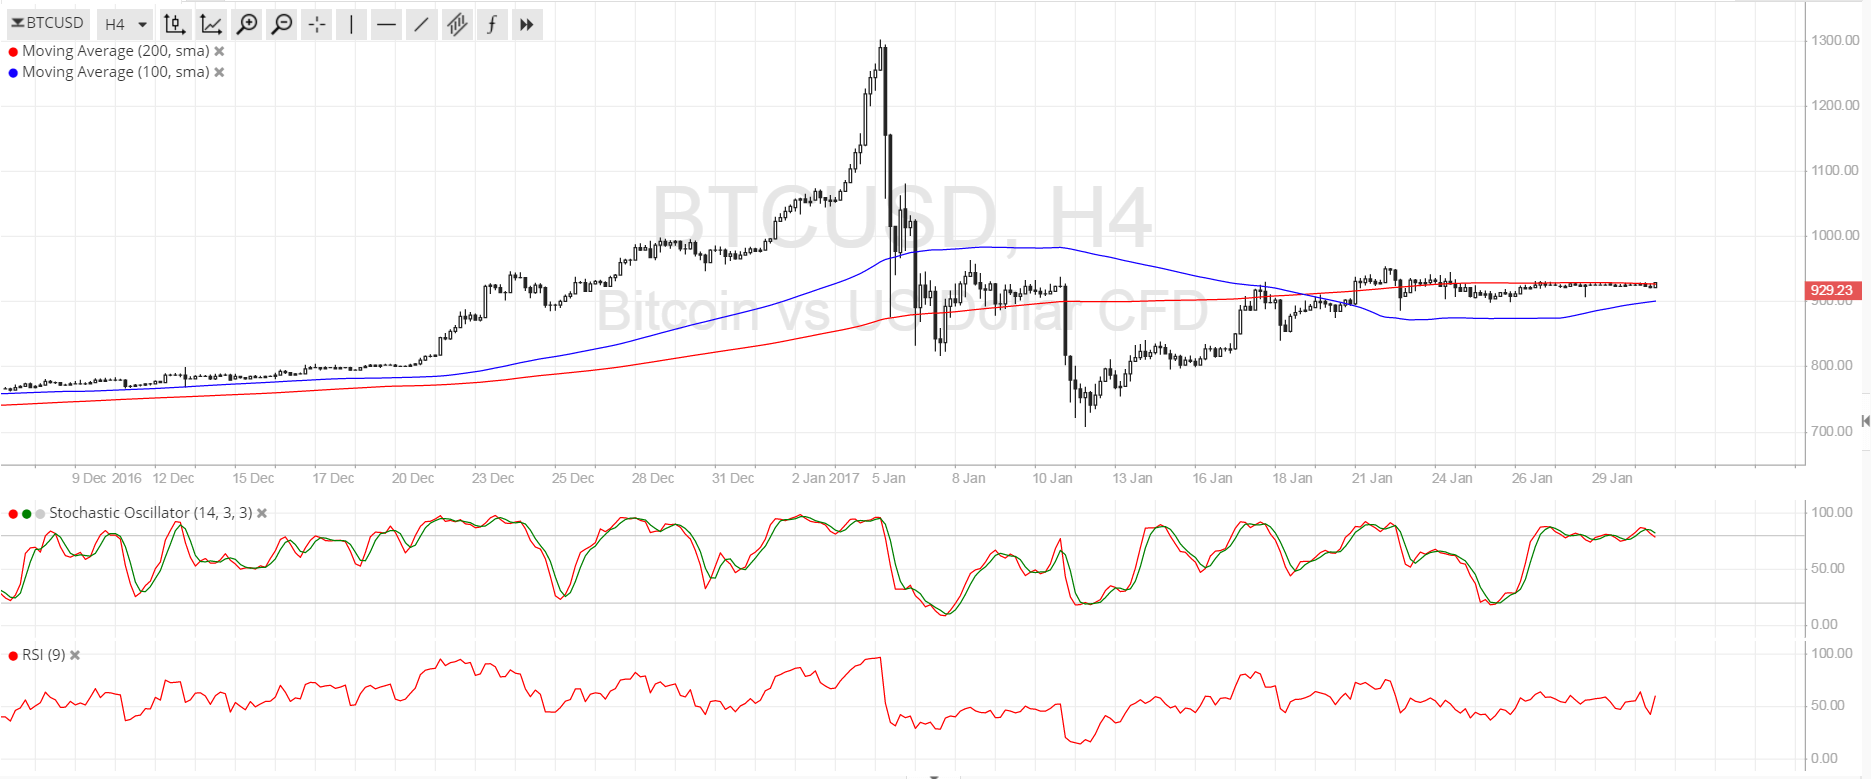
- Zooming out to the 4-hour time frame shows that bitcoin price is still stuck in that area of interest that held as support or resistance in the past.
- Technical indicators seem to be signaling a downside break.
Bitcoin price is currently squeezing in a tight consolidation pattern as liquidity has been dampened and traders are waiting for stronger catalysts.
Technical Indicators Signals
The 100 SMA is below the longer-term 200 SMA on the 4-hour chart so the path of least resistance is to the downside. This means that a break lower from consolidation is more likely to take place than a break higher. However, the gap between the moving averages is narrowing and an upward crossover seems imminent.
If that materializes, buying pressure could pick up and trigger a break past the 200 SMA dynamic inflection point and area of interest at $925-950. In that case, bitcoin price could have a clear path towards the next resistance at $1000. On the other hand, a break lower could send it back down to $800 then to the lows near $700.
Stochastic has been indicating overbought conditions for quite some time and turning lower could draw more sellers to the mix. RSI is treading sideways, barely offering any strong directional clues for bitcoin price at the moment.

Market Events
Chinese regulators seem to have successfully curbed bitcoin trading activity in the mainland, hurting liquidity and forcing bitcoin price to move sideways. In case you missed it, officials have been busy cracking down on bitcoin exchanges and some have already introduced trading restrictions to be in compliance.
Meanwhile, the US dollar is also being pushed and pulled by opposing forces. On the one hand, expectations of additional Fed rate hikes are keeping the currency supported but uncertainty surrounding the Trump administration is discouraging traders from piling on their long positions. Traders could look to the FOMC statement and NFP release later this week to determine their dollar bias in relation to bitcoin price.
Charts from SimpleFX